

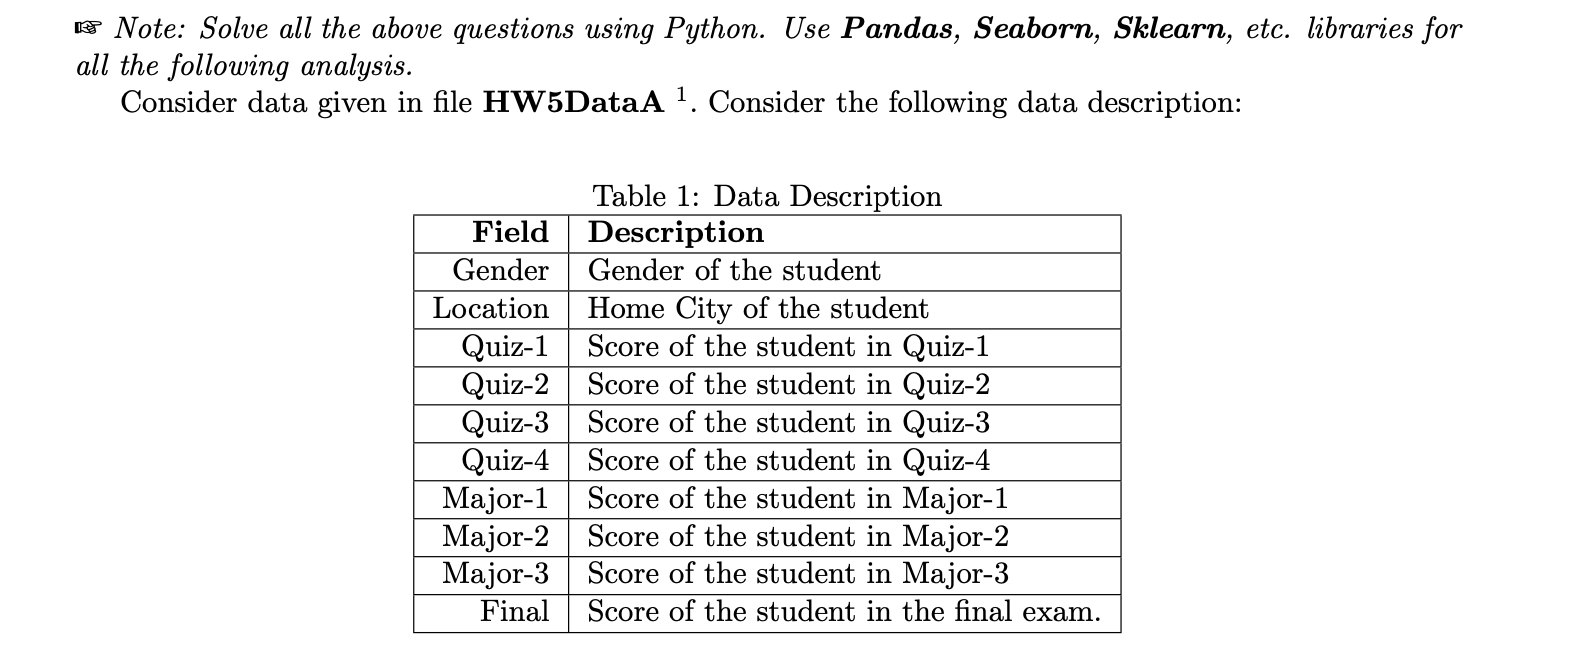
Note: Solve all the above questions using Python. Use Pandas, Seaborn, Sklearn, etc. libraries for all...
Fantastic news! We've Found the answer you've been seeking!
Question:
Expert Answer:
First lets import the necessary libraries and load the data into a Pandas DataFrame import pandas as pd import seaborn as sns import matplotlibpyplot as plt from sklearnlinearmodel import LinearRegres... View the full answer

Related Book For 

Applied Regression Analysis and Other Multivariable Methods
ISBN: 978-1285051086
5th edition
Authors: David G. Kleinbaum, Lawrence L. Kupper, Azhar Nizam, Eli S. Rosenberg
Posted Date:
