Answered step by step
Verified Expert Solution
Link Copied!

Question

1 Approved Answer

The data setPrice History Commonwealth bank, available attached below contains the history stock price of the Commonwealth Bank of Australia (CBA) from January 2012 to

The data setPrice History Commonwealth bank, available attached below contains the history stock

price of the Commonwealth Bank of Australia (CBA) from January 2012 to September 2020.

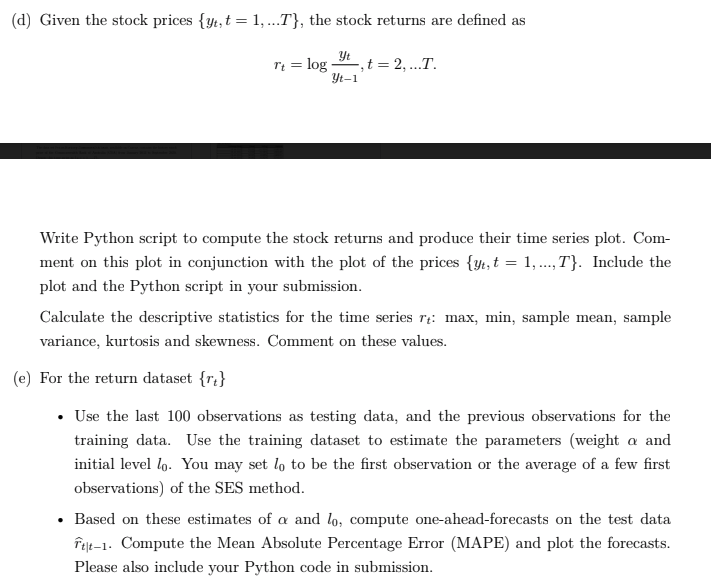
Denote this time series as{yt, t= 1, ..., T}.

dataset link is attached below. questions are in the picture. please answer both (d) and (e),

https://drive.google.com/file/d/17bCsgUEXBRbP79NyO70d37at3GWwMfXT/view?usp=sharing

image text in transcribed
[(1] Given the stock prices {yh t = l, ...T}, the stock returns are dened as r = lo , t = 2, ...T. t 3 911 Write Python script to compute the stock returns and produce their time series plot. Com ment on this plot in conjunction with the plot of the prices {91, t = 1, ...,T}. Include the plot and the Python script in your submission. lGalculate the descriptive statistics for the time series r._: max, min, sample mean, sample variance, kurtcsis and slcewness. lSomment on these values. [a] For the return dataset {rt} . Use the last l observations as testing data, and the previous observations for the training data. Use the training dataset to estimate the parameters {weight or and initial level ll. You ma},r set lg. to be the rst observation or the average of a few rst observations] of the SES method. . Based on these estimates of :1 and In, compute oneaheadforecasts on the test data Fg|f_1. Compute the Mean Absolute Percentage Error [MAPE] and plot the forecasts. Please also include your Python code in submislon

Step by Step Solution

There are 3 Steps involved in it

Step: 1

blur-text-image

Get Instant Access to Expert-Tailored Solutions

See step-by-step solutions with expert insights and AI powered tools for academic success

Step: 2

blur-text-image

Step: 3

blur-text-image

Ace Your Homework with AI

Get the answers you need in no time with our AI-driven, step-by-step assistance

Get Started

Recommended Textbook for

Mathematical Applications For The Management, Life And Social Sciences

Authors: Ronald J. Harshbarger, James J. Reynolds

12th Edition

978-1337625340

More Books

Students also viewed these Mathematics questions

Question

=+a. (**) Develop X and R charts based on these available data.

Answered: 1 week ago