

Question
The data source is from Taiwans Taxation Bureau, which consists of 5 local branches all over Taiwan. In the tables below, we can have a
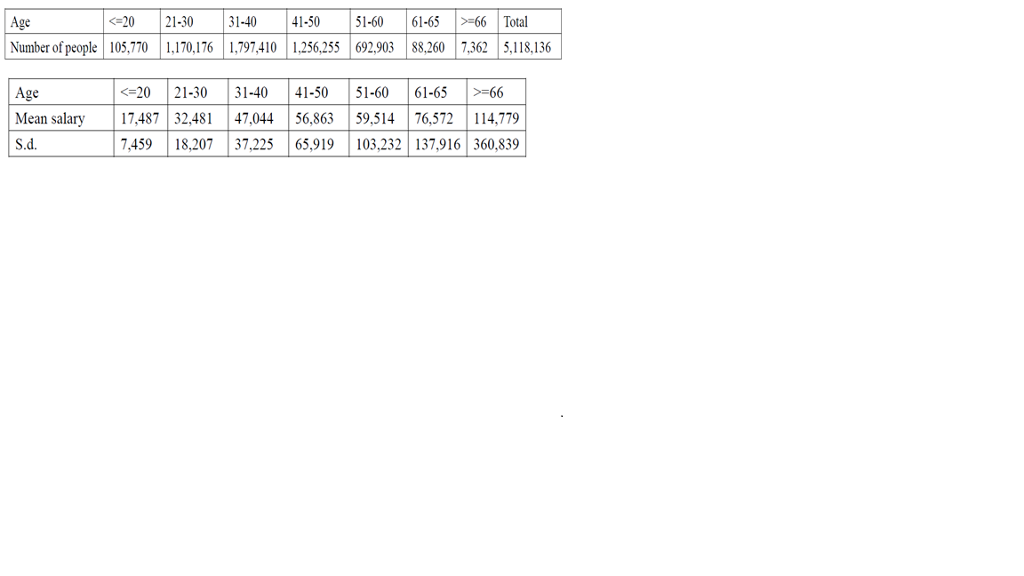
The data source is from Taiwans Taxation Bureau, which consists of 5 local branches all over Taiwan. In the tables below, we can have a basic understanding of the monthly salary distribution of full-time Taiwanese employees in 2015. Although the total population in Taiwan is estimated over 23.5 million people in 2015, only 5.11 million peoples salary information can be accurately ascertained after considering multiple demographic criteria and checking the accuracy of income records. All of the following statistics in the tables are calculated by Ministry of Finance, Taiwan, using the income data from Taxation Bureau.
 From the above tables, you can assume the population data of salaries of full-time Taiwanese employees are available for us to carry out more detailed analytics.
(a) Although the average monthly salary can be an indicator of central tendency to represent the typical earnings of a Taiwanese, it may not be a good indicator sometimes, due to the impact of extreme income levels in the population. Thus, we also want to know a Taiwaneses median monthly salary to get a full picture of the salary distribution. However, this piece of information is lacking. Please find out the possible estimate of the median monthly salary by using Python simulation. That is, please use simulation to generate a random sample of size 200 using the population information provided in the above tables. Moreover, we make an explicit distributional assumption on the agespecific salary subpopulations. For example, we assume that for those Taiwanese under 20 years of age, their monthly salary population will be a normal distribution with mean 17,487 and variance 7,4592. Similarly, the salary population of Taiwanese with age between 21 and 30 follows another normal distribution with mean 32,481 and variance 18,2072. All other agespecific salary subpopulations can be defined accordingly. Please use Python to obtain a random sample of size 200 and estimate the sample median monthly salary. Note: In your sample, the age-group composition of the sample must be the same (or very close to) the age-group composition of the population. For example, the 21-30 age group constitutes 22.86% (1,170,176/5,118,136) of the population. Hence, in your sample, 46 persons should come from 21-30 age group.
(b) Please perform repeated random sampling of size 200 from Taiwanese population and figure out the sampling distribution of sample median monthly salary. (The sampling distribution must be constructed with 5000 repeated sampling outcomes and you need to visualize the sampling distribution simulated as your answers).
(c) Please repeat your repeated sampling in (b), but now you need to increase the sample size from 200 to 500 and 1000. Comment on the shape of the sampling distribution of the median monthly salary.When the sample size increases, is the sampling distribution of the median monthly salary approaching a normal distribution? (Please draw a panel of histograms to present your visualization).
20 21-30 31-40 41-50 51-60 61-65 -66 Total Age Number of people 105,70 1,170,176 1.797410 1256255692903 88,260 7.362 5,118,136 20 21-30 31-40 41-5051-60 61-6566 AgeStep by Step Solution
There are 3 Steps involved in it
Step: 1

Get Instant Access to Expert-Tailored Solutions
See step-by-step solutions with expert insights and AI powered tools for academic success
Step: 2

Step: 3
Ace Your Homework with AI
Get the answers you need in no time with our AI-driven, step-by-step assistance
Get Started
Database Theory And Application International Conference DTA 2009 Held As Part Of The Future Generation Information Technology Conference FGIT In Computer And Information Science 64
Authors: Dominik Slezak ,Yanchun Zhang
2009th Edition
3642105823, 978-3642105821