Answered step by step
Verified Expert Solution
Link Copied!

Question

1 Approved Answer

The data to the right show the average retirement ages for a random sample of workers in Country A and a random sample of workers
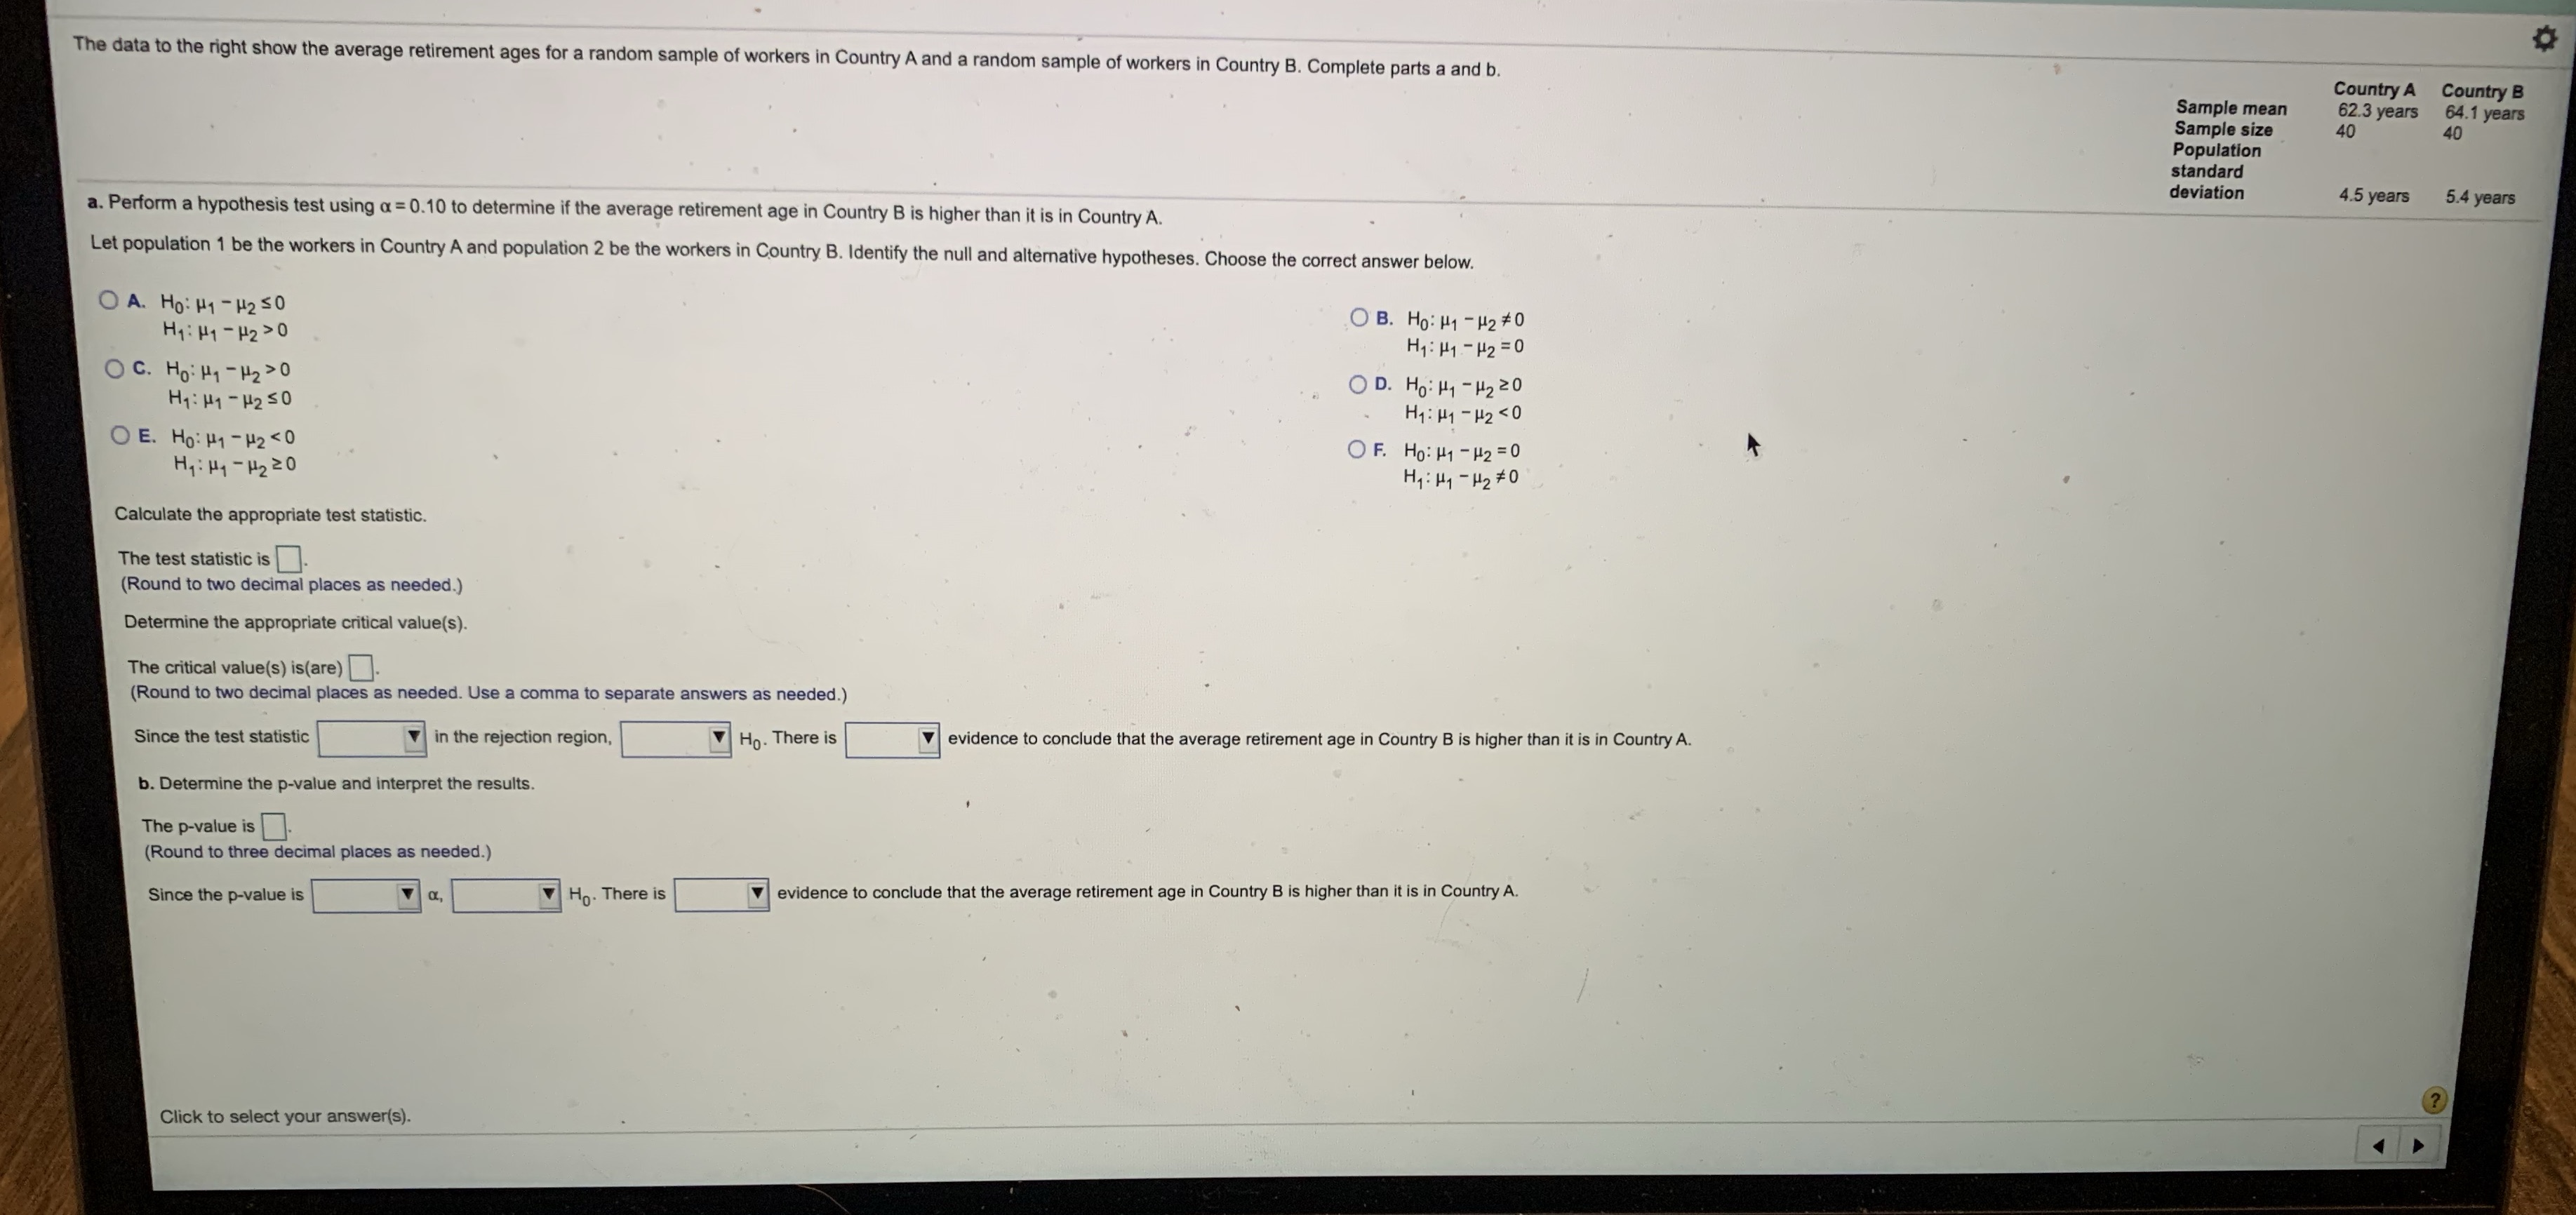
image text in transcribed
The data to the right show the average retirement ages for a random sample of workers in Country A and a random sample of workers in Country B. Complete parts a and b. Country A Country B Sample mean 62.3 years 64.1 years Sample size 40 40 Population standard deviation 4.5 years 5.4 years a. Perform a hypothesis test using a = 0.10 to determine if the average retirement age in Country B is higher than it is in Country A. Let population 1 be the workers in Country A and population 2 be the workers in Country B. Identify the null and alternative hypotheses. Choose the correct answer below. O A. HO: H1 - H2 50 O B. HO: H1 - H2 # 0 H1:141 - H2>0 H1: H1 - H2 = 0 OC. Ho: H1 - H2 20 OD. HO: H1 - H2 20 H1: H1 - H2 50 H1: H1 - H2

Step by Step Solution

There are 3 Steps involved in it

Step: 1

blur-text-image

Get Instant Access to Expert-Tailored Solutions

See step-by-step solutions with expert insights and AI powered tools for academic success

Step: 2

blur-text-image

Step: 3

blur-text-image

Ace Your Homework with AI

Get the answers you need in no time with our AI-driven, step-by-step assistance

Get Started

Recommended Textbook for

Elementary Algebra

Authors: Charles P McKeague

3rd Edition

1483263843, 9781483263847

More Books

Students also viewed these Mathematics questions