Answered step by step
Verified Expert Solution
Link Copied!

Question

1 Approved Answer

The diagram below shows the Australian employment level for different age groups. Which group tend to have above-average unemployment rates, and which groups tend to
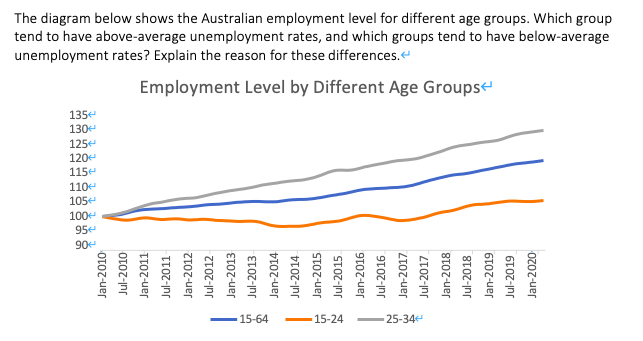
image text in transcribed

The diagram below shows the Australian employment level for different age groups. Which group tend to have above-average unemployment rates, and which groups tend to have below-average unemployment rates? Explain the reason for these differences. Employment Level by Different Age Groups 135 130- 125 1204 115 110 105 100 952 90 Jan-2010 Jul-2010 Jan-2011 Jul-2011 Jan-2012 Jul-2012 Jan-2013 Jul-2013 Jan-2014 Jul-2014 Jan-2015 Jul-2015 Jan-2016 Jul-2016 Jan-2017 Jul-2017 Jan-2018 Jul-2018 Jan-2019 Jul-2019 Jan-2020 15-64 15-24 25-34

Step by Step Solution

There are 3 Steps involved in it

Step: 1

blur-text-image

Get Instant Access to Expert-Tailored Solutions

See step-by-step solutions with expert insights and AI powered tools for academic success

Step: 2

blur-text-image

Step: 3

blur-text-image

Ace Your Homework with AI

Get the answers you need in no time with our AI-driven, step-by-step assistance

Get Started

Students also viewed these Accounting questions