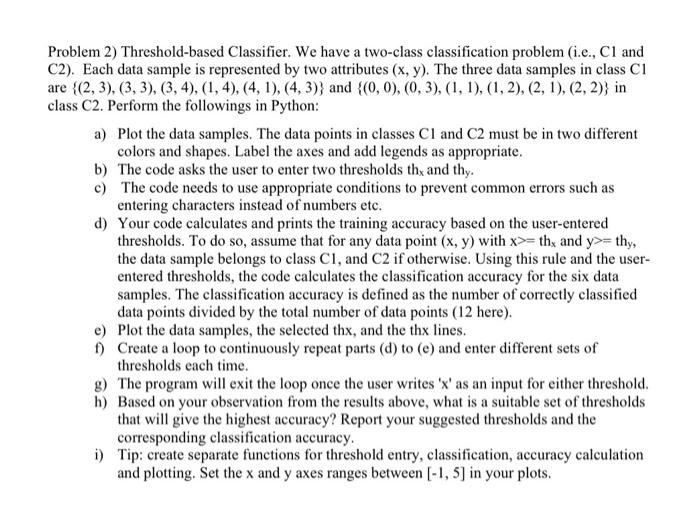
- The entire assignment has to be submitted "electronically on Canvas" before the deadline. - Each assignment should have the following information on the first page: assignment number, student name and z-number, and a shareable link to the final version of your Python code in Colab. In your Colab notebook, click 'Share' on the upper right corner to get a shareable link, then click 'Get shareable link' and copy the link. - The Python submission should include the codes and the generated outputs. To generate the PDF submission file: in Colab, go to 'File' 'Print', then change the 'Destination' to 'Save as PDF' and save. - ONLY one file must be submitted electronically. Combine the handwritten and Python parts before submission. You can upload the pictures of your handwritten answers to the drive and then import and show them in a Colab notebook using the matplotlib library. - Filename for electronic submission: Student_Name_Assignmentxx.pdf or doc. * One point will be deducted from any submission that does not follow the above instructions. Problem 2) Threshold-based Classifier. We have a two-class classification problem (i.e., C1 and C2). Each data sample is represented by two attributes (x,y). The three data samples in class C1 are {(2,3),(3,3),(3,4),(1,4),(4,1),(4,3)} and {(0,0),(0,3),(1,1),(1,2),(2,1),(2,2)} in class C2. Perform the followings in Python: a) Plot the data samples. The data points in classes C1 and C2 must be in two different colors and shapes. Label the axes and add legends as appropriate. b) The code asks the user to enter two thresholds thx and thy. c) The code needs to use appropriate conditions to prevent common errors such as entering characters instead of numbers etc. d) Your code calculates and prints the training accuracy based on the user-entered thresholds. To do so, assume that for any data point (x,y) with x>=thx and y>=thy, the data sample belongs to class C1, and C2 if otherwise. Using this rule and the userentered thresholds, the code calculates the classification accuracy for the six data samples. The classification accuracy is defined as the number of correctly classified data points divided by the total number of data points ( 12 here). e) Plot the data samples, the selected thx, and the thx lines. f) Create a loop to continuously repeat parts (d) to (e) and enter different sets of thresholds each time. g) The program will exit the loop once the user writes ' x ' as an input for either threshold. h) Based on your observation from the results above, what is a suitable set of thresholds that will give the highest accuracy? Report your suggested thresholds and the corresponding classification accuracy. i) Tip: create separate functions for threshold entry, classification, accuracy calculation and plotting. Set the x and y axes ranges between [1,5] in your plots