

Answered step by step
Verified Expert Solution
Question
1 Approved Answer
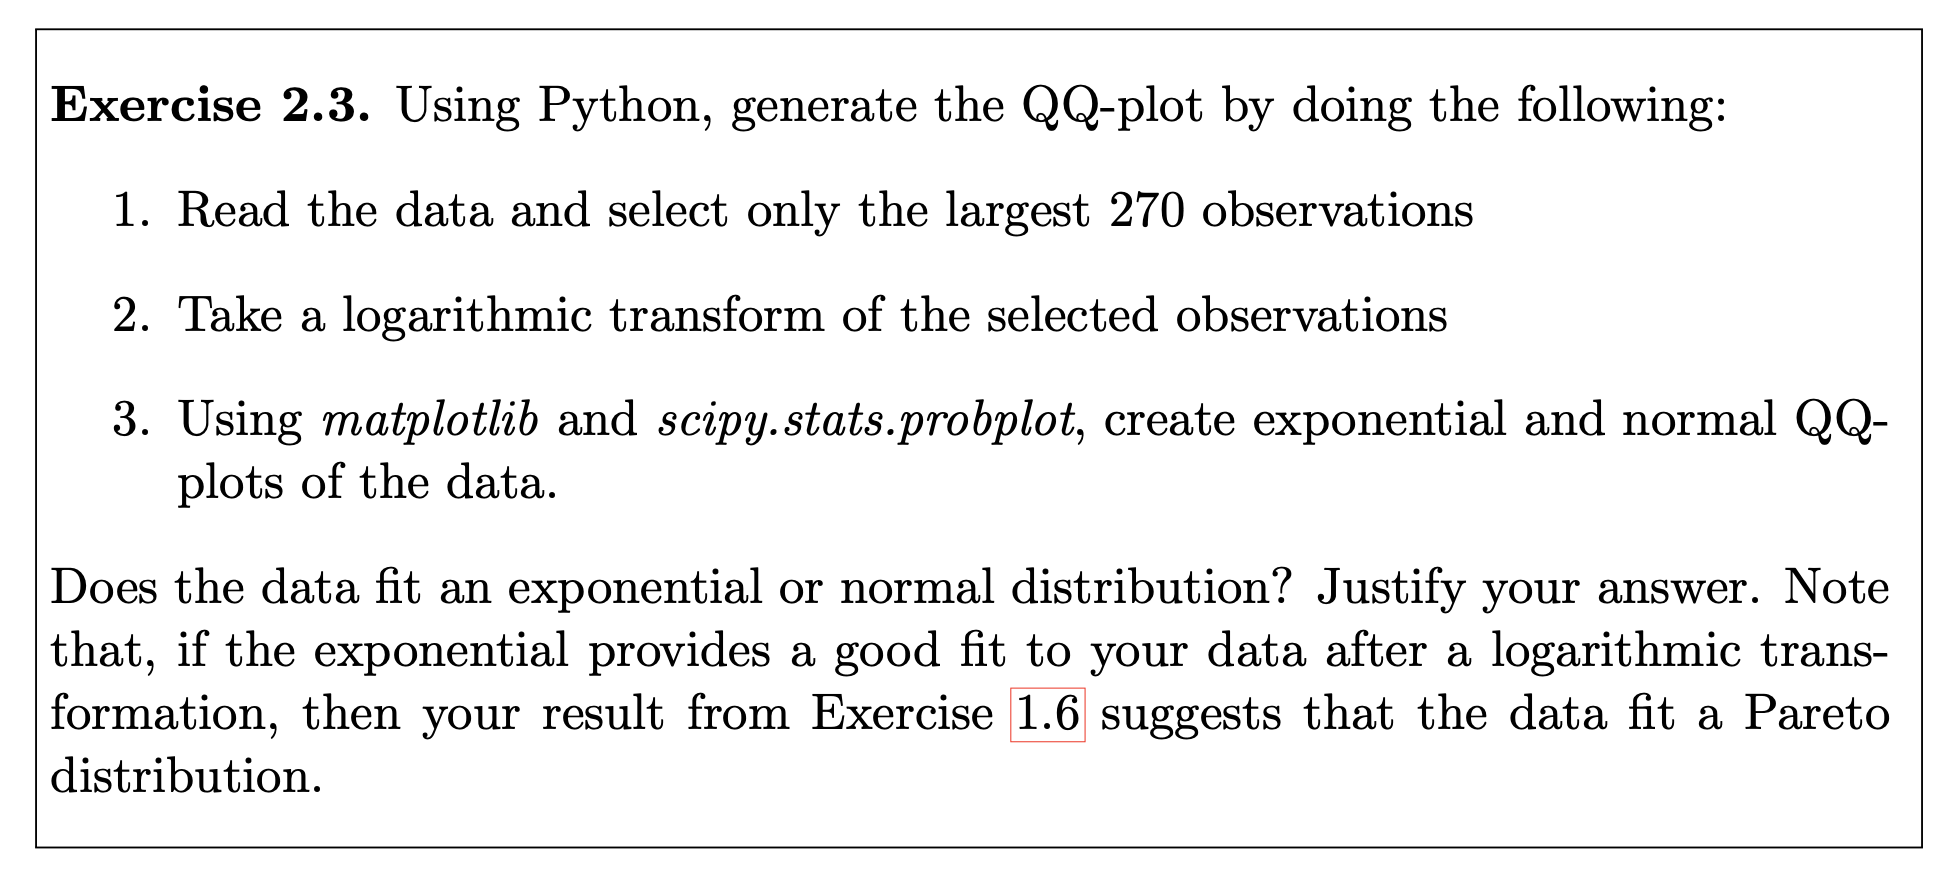
The expected is: Exercise 2.3. Using Python, generate the QQ-plot by doing the following: 1. Read the data and select only the largest 270 observations
The expected is:
Step by Step Solution
There are 3 Steps involved in it
Step: 1

Get Instant Access to Expert-Tailored Solutions
See step-by-step solutions with expert insights and AI powered tools for academic success
Step: 2

Step: 3
Ace Your Homework with AI
Get the answers you need in no time with our AI-driven, step-by-step assistance
Get Started
Introduction to Wireless and Mobile Systems
Authors: Dharma P. Agrawal, Qing An Zeng
4th edition
1305087135, 978-1305087132, 9781305259621, 1305259629, 9781305537910 , 978-130508713