

Answered step by step
Verified Expert Solution
Question
1 Approved Answer
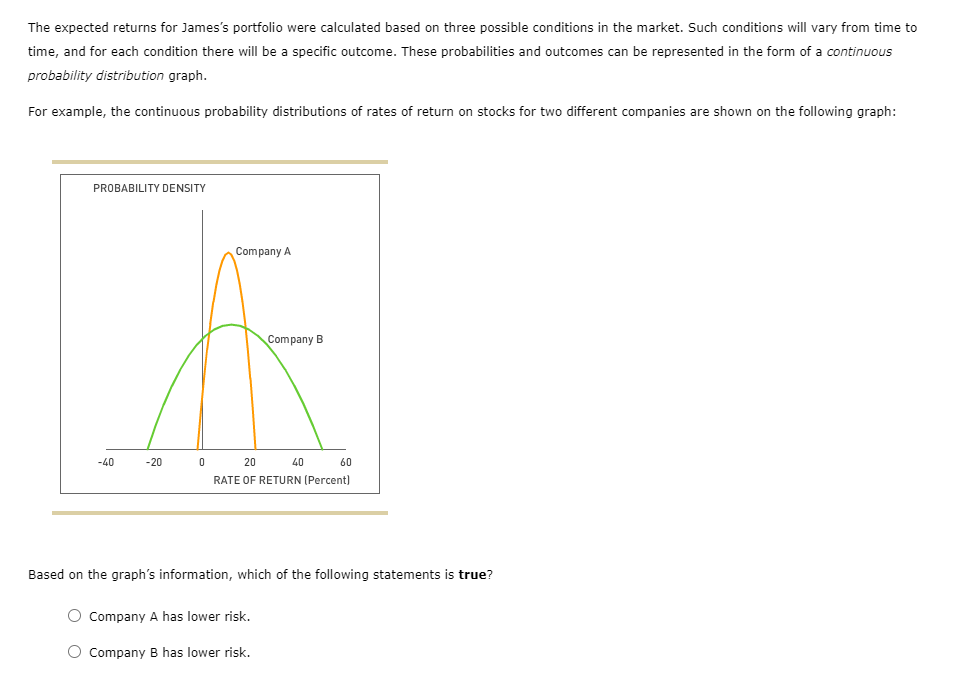
The expected returns for James's portfolio were calculated based on three possible conditions in the market. Such conditions will vary from time to time, and
Step by Step Solution
There are 3 Steps involved in it
Step: 1

Get Instant Access to Expert-Tailored Solutions
See step-by-step solutions with expert insights and AI powered tools for academic success
Step: 2

Step: 3
Ace Your Homework with AI
Get the answers you need in no time with our AI-driven, step-by-step assistance
Get Started
Options Trading 12 Books In 1 Elevate Your Profits Erase Risks The Definitive Guide From Rookie To Top 1 Trader
Authors: Warren Ray Benjamin
1st Edition
979-8860106413