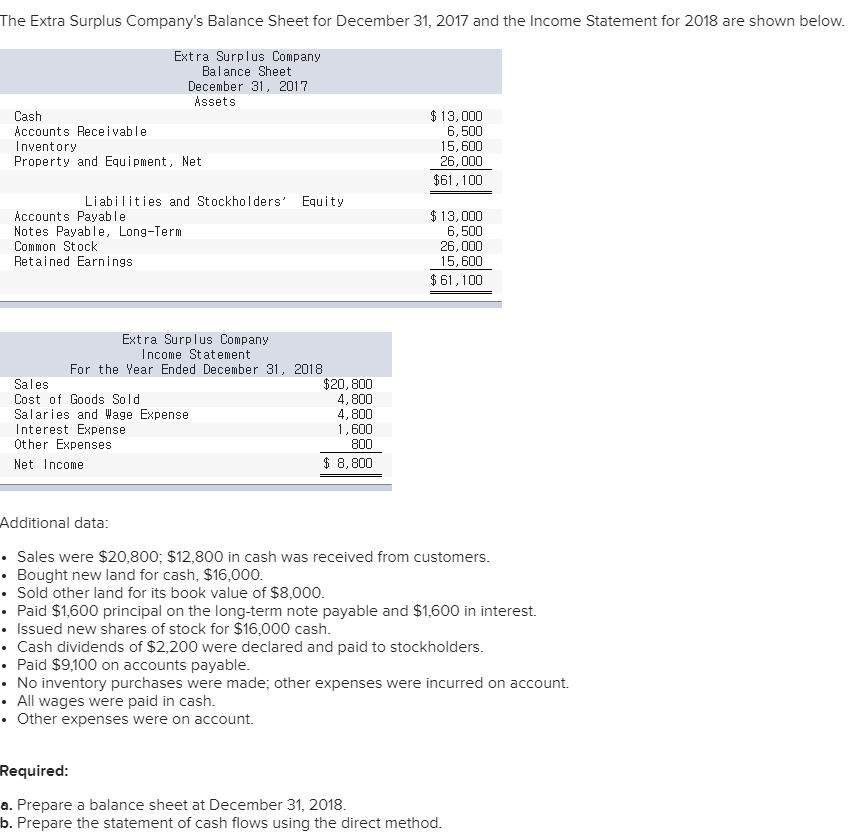
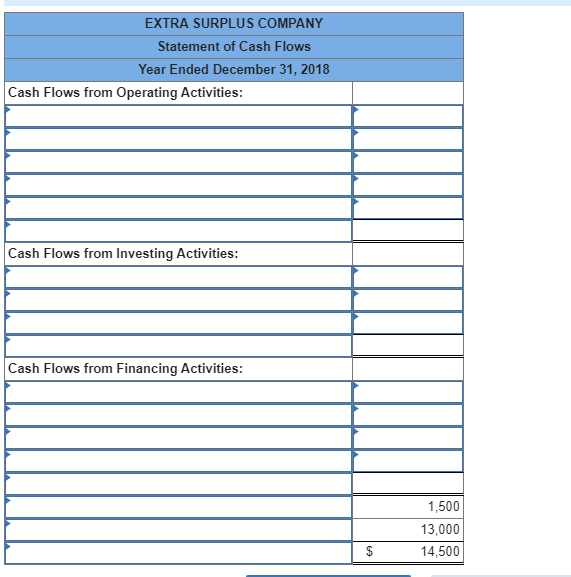
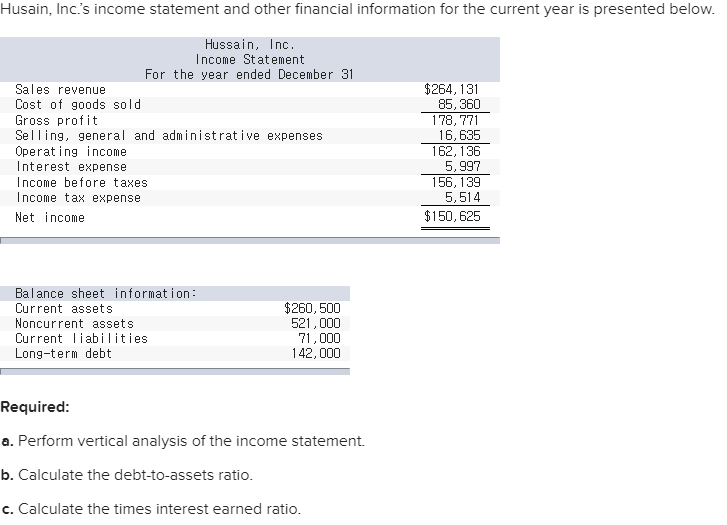
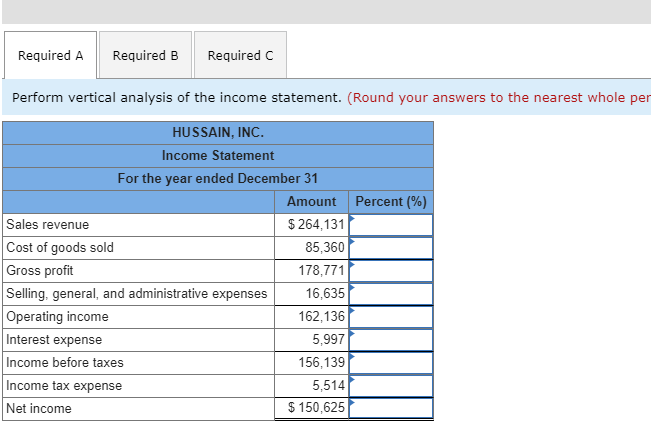

The Extra Surplus Company's Balance Sheet for December 31, 2017 and the Income Statement for 2018 are shown below. Extra Surplus Company Balance Sheet December 31, 2017 Assets Cash Accounts Receivable Inventory Property and Equipment, Net $ 13,000 6,500 15,600 26,000 $61,100 Liabilities and Stockholders' Equity Accounts Payable Notes Payable, Long-Term Common Stock Retained Earnings $ 13,000 6,500 26,000 15,600 $61,100 Extra Surplus Company Income Statement For the Year Ended December 31, 2018 Sales $20,800 Cost of Goods Sold 4,800 Salaries and Wage Expense 4,800 Interest Expense 1,600 Other Expenses 800 Net Income $ 8, 800 Additional data: Sales were $20,800; $12,800 in cash was received from customers. Bought new land for cash, $16,000. Sold other land for its book value of $8,000. Paid $1,600 principal on the long-term note payable and $1,600 in interest. Issued new shares of stock for $16,000 cash Cash dividends of $2,200 were declared and paid to stockholders. Paid $9,100 on accounts payable. No inventory purchases were made; other expenses were incurred on account. All wages were paid in cash. Other expenses were on account. Required: a. Prepare a balance sheet at December 31, 2018. b. Prepare the statement of cash flows using the direct method. Prepare a balance sheet at December 31, 2018. EXTRA SURPLUS COMPANY Balance Sheet at December 31 2018 EXTRA SURPLUS COMPANY Statement of Cash Flows Year Ended December 31, 2018 Cash Flows from Operating Activities: Cash Flows from Investing Activities: Cash Flows from Financing Activities: 1,500 13,000 14,500 Husain, Inc.'s income statement and other financial information for the current year is presented below. Hussain, Inc. Income Statement For the year ended December 31 Sales revenue Cost of goods sold Gross profit Selling, general and administrative expenses Operating income Interest expense Income before taxes Income tax expense Net income $264, 131 85,360 178, 771 16,635 162, 136 5,997 156,139 5,514 $150,625 Balance sheet information: Current assets Noncurrent assets Current liabilities Long-term debt $260,500 521,000 71,000 142,000 Required: a. Perform vertical analysis of the income statement. b. Calculate the debt-to-assets ratio. c. Calculate the times interest earned ratio. Required A Required B Required C Perform vertical analysis of the income statement. (Round your answers to the nearest whole per HUSSAIN, INC. Income Statement For the year ended December 31 Amount Percent (%) Sales revenue $ 264,131 Cost of goods sold 85,360 Gross profit 178,771 Selling, general, and administrative expenses 16,635 Operating income 162,136 Interest expense 5.997 Income before taxes 156,139 Income tax expense 5,514 Net income $ 150,625 Debt-to-assets Ratio Interest Earned Ratio P