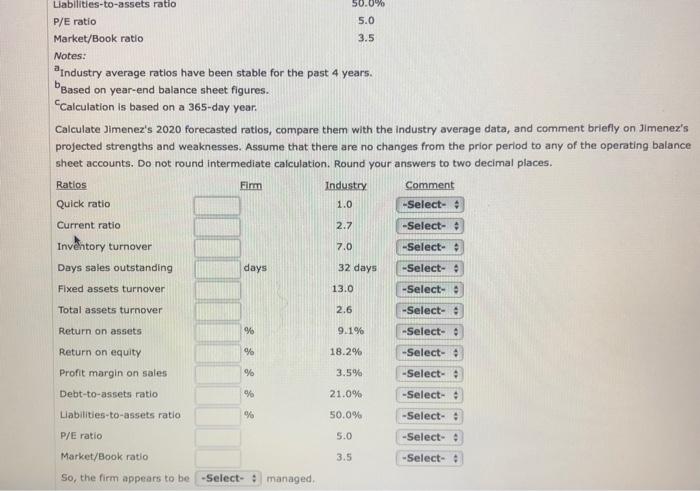
The far row for 'comment' is either bad, good, strong, weak, poor, high, low, high
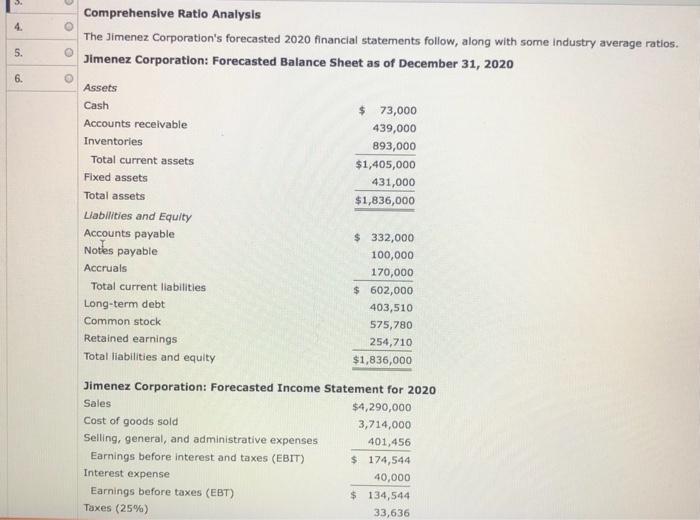
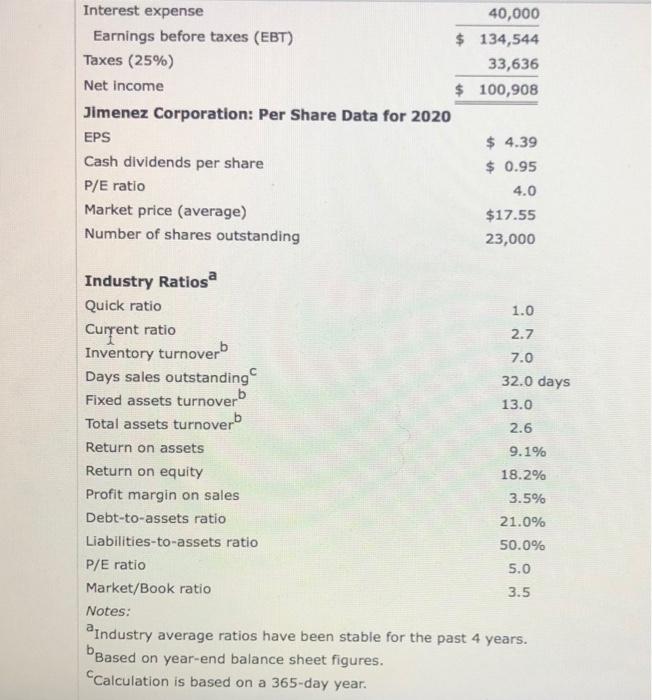
4 5. 6. e Comprehensive Ratio Analysis The Jimenez Corporation's forecasted 2020 financial statements follow, along with some industry average ratios. Jimenez Corporation: Forecasted Balance Sheet as of December 31, 2020 Assets Cash $ 73,000 Accounts receivable 439,000 Inventories 893,000 Total current assets $1,405,000 Fixed assets 431,000 Total assets $1,836,000 Liabilities and Equity Accounts payable $ 332,000 Notes payable 100,000 Accruals 170,000 Total current liabilities $ 602,000 Long-term debt 403,510 Common stock 575,780 Retained earnings 254,710 Total liabilities and equity $1,836,000 Jimenez Corporation: Forecasted Income Statement for 2020 Sales $4,290,000 Cost of goods sold 3,714,000 Selling, general, and administrative expenses 401,456 Earnings before interest and taxes (EBIT) $ 174,544 Interest expense 40,000 Earnings before taxes (EBT) $ 134,544 Taxes (25%) 33,636 Interest expense 40,000 Earnings before taxes (EBT) $ 134,544 Taxes (25%) 33,636 Net Income $ 100,908 Jimenez Corporation: Per Share Data for 2020 EPS $ 4.39 Cash dividends per share $ 0.95 P/E ratio 4.0 Market price (average) $17.55 Number of shares outstanding 23,000 Industry Ratiosa Quick ratio 1.0 Current ratio 2.7 Inventory turnoverb 7.0 Days sales outstanding 32.0 days Fixed assets turnoverb 13.0 Total assets turnoverb 2.6 Return on assets 9.1% Return on equity 18.2% Profit margin on sales 3.5% Debt-to-assets ratio 21.0% Liabilities-to-assets ratio 50.0% P/E ratio 5.0 Market/Book ratio 3.5 Notes: Industry average ratios have been stable for the past 4 years. Based on year-end balance sheet figures. Calculation is based on a 365-day year. Liabilities-to-assets ratio P/E ratio Market/Book ratio 50.0% 5.0 3.5 Notes: industry average ratios have been stable for the past 4 years. Based on year-end balance sheet figures. Calculation is based on a 365-day year. Calculate Jimenez's 2020 forecasted ratlos, compare them with the industry average data, and comment briefly on Jimenez's projected strengths and weaknesses. Assume that there are no changes from the prior period to any of the operating balance sheet accounts. Do not round intermediate calculation. Round your answers to two decimal places. Industry Comment Quick ratio -Select- Ratios Fimm 1.0 2.7 -Select- Current ratio Inventory turnover Days sales outstanding 7.0 -Select- days 32 days -Select- Fixed assets turnover 13.0 -Select- 2.6 Total assets turnover Return on assets 9 9.1% Return on equity % 18.2% -Select- -Select- -Select- -Select- -Select- -Select- : %% 3.5% % 21.0% Profit margin on sales Debt-to-assets ratio Liabilities-to-assets ratio P/E ratio 50.0% 5.0 -Select- Market/Book ratio 3.5 -Select- So, the firm appears to be -Select managed