Question
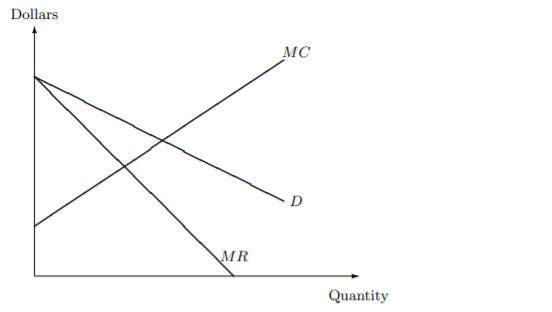
The figure below represents the situation faced by a monopolist. The demand curve is labeled D, the marginal revenue MR, the marginal cost MC (a)
The figure below represents the situation faced by a monopolist. The demand curve is labeled D, the marginal revenue MR, the marginal cost MC
(a) In the figure, indicate the profit maximizing price and output level and label them P1 and Q1. Then, indicate the area representing the deadweight loss (the loss in efficiency due to monopoly pricing) relative to the competitive outcome. (b) Explain why the marginal revenue curve lies below the demand curve. (c) Find and discuss an empirical example where a firm with market power engages in price discrimination. In your example, would you expect price discrimination to promote or lower social welfare? (d) Suppose the monopolist has launched a successful advertising campaign and the demand for the monopolist's product has become less elastic. Then, according to the mark-up pricing formula P = eP/1+eP x (MC), the monopolist will now want to increase the price of its product. Is this statement is correct or incorrect. Explain the intuition.

Step by Step Solution
There are 3 Steps involved in it
Step: 1

Get Instant Access to Expert-Tailored Solutions
See step-by-step solutions with expert insights and AI powered tools for academic success
Step: 2

Step: 3

Ace Your Homework with AI
Get the answers you need in no time with our AI-driven, step-by-step assistance
Get Started


