

Question
The figure below shows the distance of a car from a measuring position located on the edge of a straight road. (i) What was the
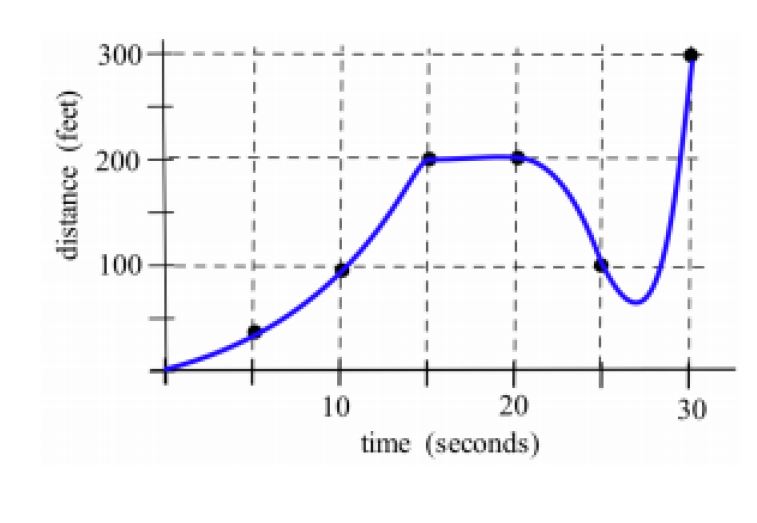
The figure below shows the distance of a car from a measuring position located on the edge of a straight road.
(i) What was the average velocity from t = 10 to t = 30 seconds?
(ii) About how fast was the car traveling at t = 10 seconds?
(iii) What does the horizontal part of the graph between t = 15 and t = 20 seconds tell you?
(iv) What does the negative velocity at t = 25 represent?
Step by Step Solution
There are 3 Steps involved in it
Step: 1

Get Instant Access to Expert-Tailored Solutions
See step-by-step solutions with expert insights and AI powered tools for academic success
Step: 2

Step: 3
Ace Your Homework with AI
Get the answers you need in no time with our AI-driven, step-by-step assistance
Get Started
Modeling the Dynamics of Life Calculus and Probability for Life Scientists
Authors: Frederick R. Adler
3rd edition
840064187, 978-1285225975, 128522597X, 978-0840064189