Question
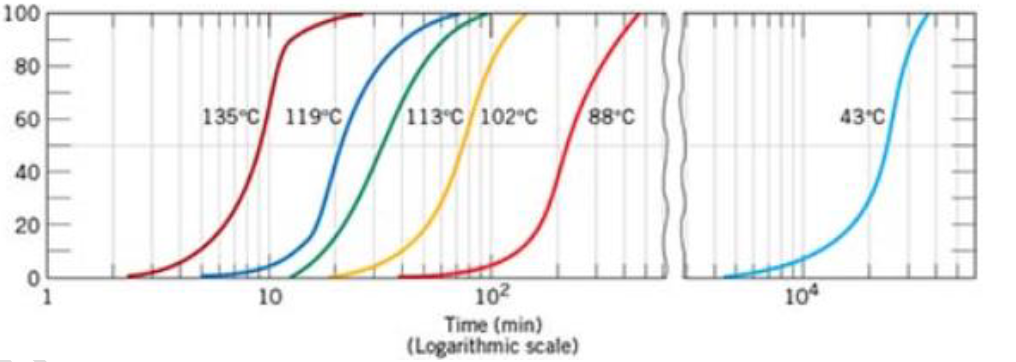
The figure below shows the kinetics of transformations of a component M that obeys the Avrami relationship at several temperatures. (a) Plot a temperature vs.
The figure below shows the kinetics of transformations of a component M that obeys the Avrami relationship at several temperatures.
(a) Plot a temperature vs. transformation rate graph; discuss the observed trend. Recommend a temperature to obtain M having fine-grained . (b) Plot a temperature vs. the time-independent exponent constant (n) graph and discuss the observed trend. (c) Determine the activation energy for the phase transformation (d ) A particular application requires M to have ~70% fine-grained . Recommend a temperature so that it takes 40 min (heat treatment) to obtain the desired microstructure
Step by Step Solution
There are 3 Steps involved in it
Step: 1

Get Instant Access to Expert-Tailored Solutions
See step-by-step solutions with expert insights and AI powered tools for academic success
Step: 2

Step: 3

Ace Your Homework with AI
Get the answers you need in no time with our AI-driven, step-by-step assistance
Get Started


