

Question
The figure given below shows the production-possibility curves of Canada (AB) and the Rest of the World (CD). The pre-trade price ratio in Canada and
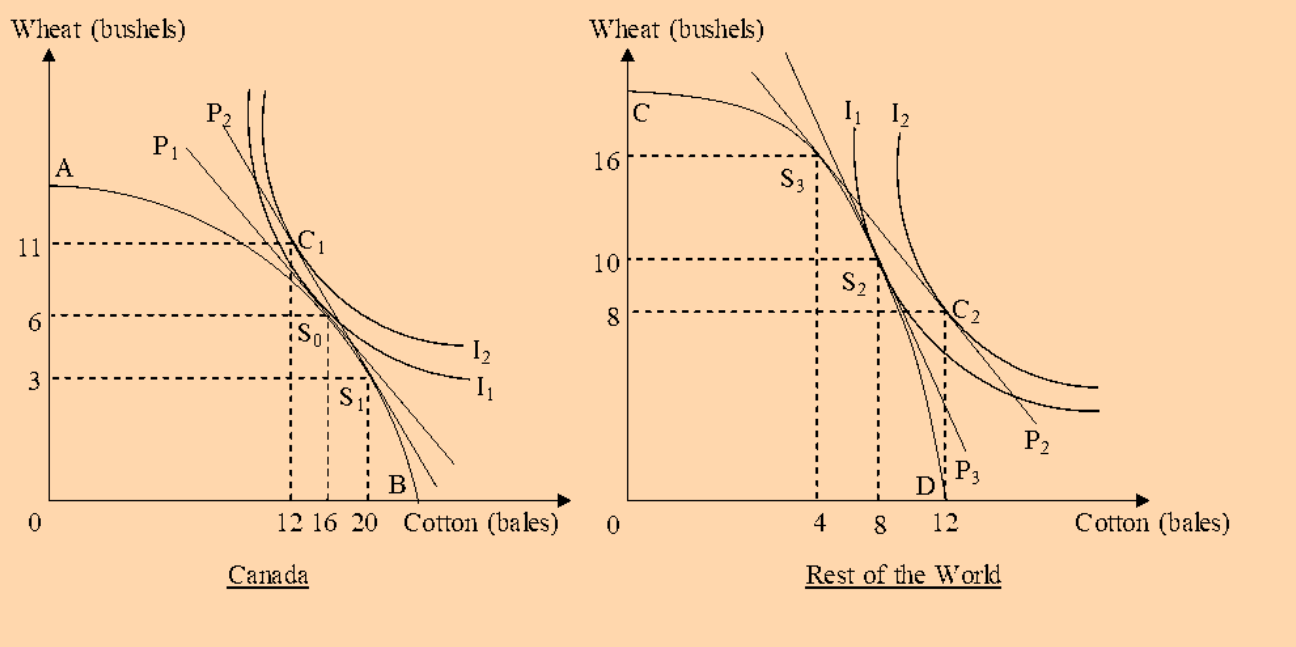
The figure given below shows the production-possibility curves of Canada (AB) and the Rest of the World (CD). The pre-trade price ratio in Canada and the Rest of the World are given by the lines P1 and P3 respectively. The international price ratio faced by the countries is represented by the line P2. I1 and I2 are the pre-trade and post-trade social indifference curves for both Canada and the Rest of the World respectively. As a result of specialization and trade, cotton production in the world increases by _____ bale(s) and wheat production increases by _____ bushel(s).
Step by Step Solution
There are 3 Steps involved in it
Step: 1

Get Instant Access to Expert-Tailored Solutions
See step-by-step solutions with expert insights and AI powered tools for academic success
Step: 2

Step: 3
Ace Your Homework with AI
Get the answers you need in no time with our AI-driven, step-by-step assistance
Get Started
Advanced Placement Microeconomics
Authors: Bill Hurd
1st Edition
1531150306, 978-1531150303