

Answered step by step
Verified Expert Solution
Question
1 Approved Answer
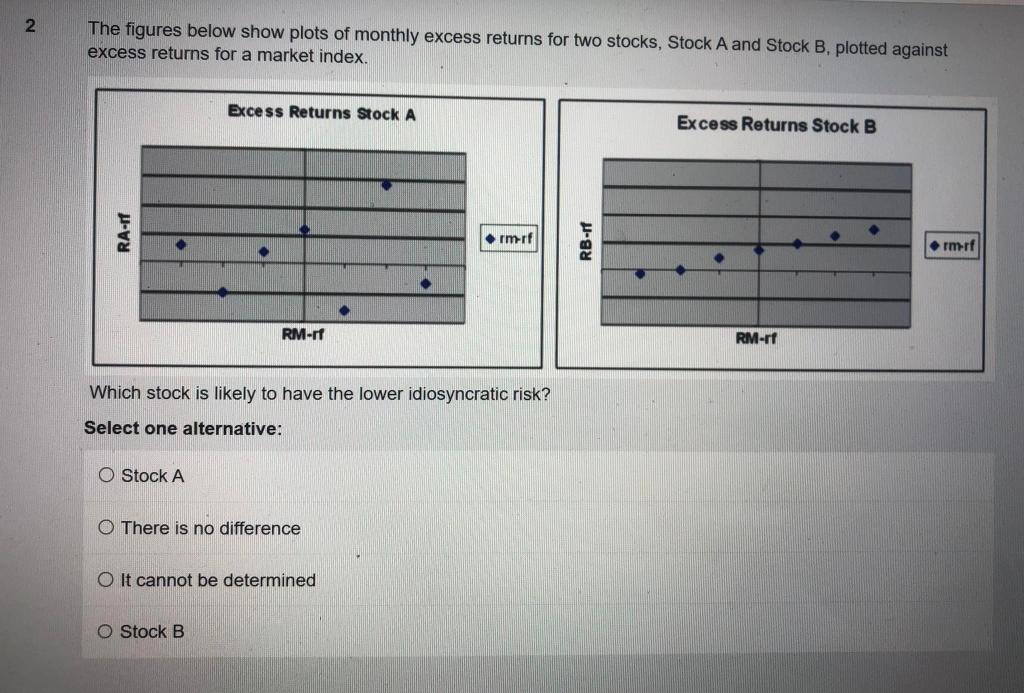
The figures below show plots of monthly excess returns for two stocks, Stock A and Stock B, plotted against excess returns for a market index.
Step by Step Solution
There are 3 Steps involved in it
Step: 1

Get Instant Access to Expert-Tailored Solutions
See step-by-step solutions with expert insights and AI powered tools for academic success
Step: 2

Step: 3
Ace Your Homework with AI
Get the answers you need in no time with our AI-driven, step-by-step assistance
Get Started
The Commercial Real Estate Investors Handbook
Authors: Steven D. Fisher
1st Edition
1601380372, 978-1601380371