

Question
The figures below show the AS-AD model, depicting GDP on the horizontal axis and the price level on the vertical axis. The AS (aggregate supply)
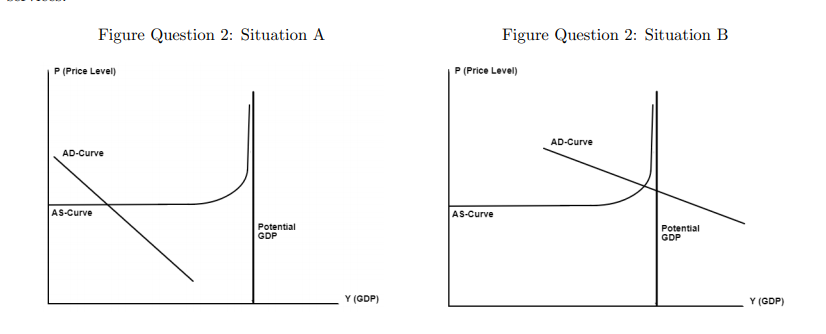
The figures below show the AS-AD model, depicting GDP on the horizontal axis and the price level on the vertical axis. The AS (aggregate supply) curve shows firms' willingness to produce final goods and services; the AD (aggregate demand) curve shows economy-wide demand for final goods and services.
(a) Explain why the AD curve is decreasing.
(b) Determine the effect of a decrease in personal income taxes on the GDP and the price level for situation A and B. What are the differences between the effects in situation A and B?
(c) How would you model long-term economic growth in the AS-AD model? Stated differently, how does the development of more productive technologies affect the above AS-AD figure?
Step by Step Solution
There are 3 Steps involved in it
Step: 1

Get Instant Access to Expert-Tailored Solutions
See step-by-step solutions with expert insights and AI powered tools for academic success
Step: 2

Step: 3
Ace Your Homework with AI
Get the answers you need in no time with our AI-driven, step-by-step assistance
Get Started
Managerial economics
Authors: william f. samuelson stephen g. marks
7th edition
9781118214183, 1118041585, 1118214188, 978-1118041581