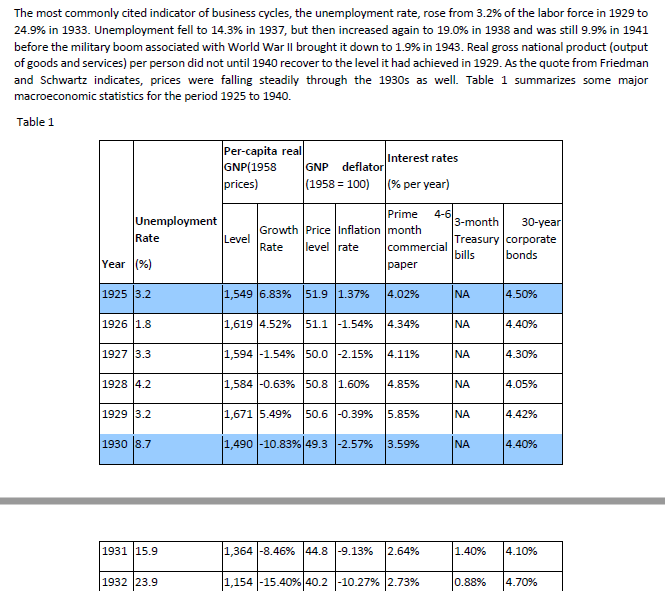
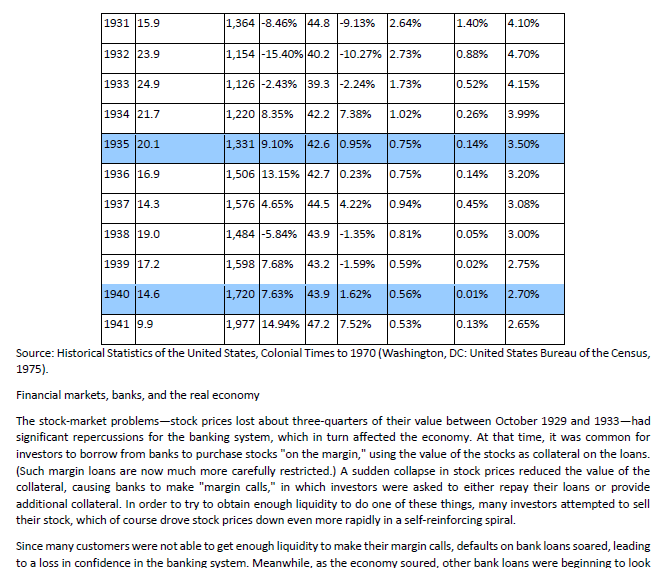
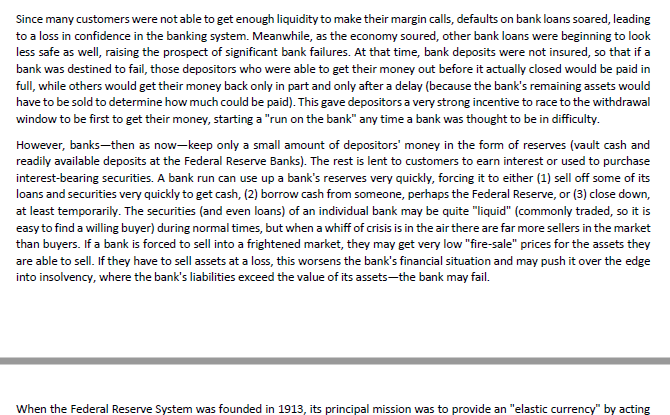
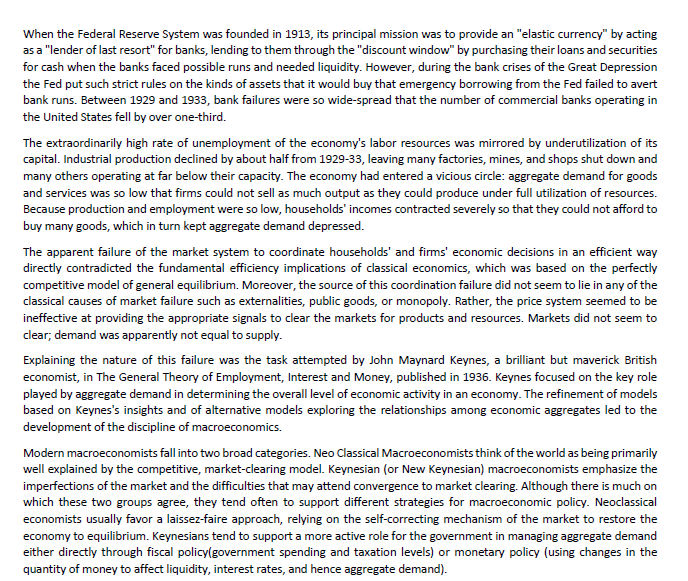
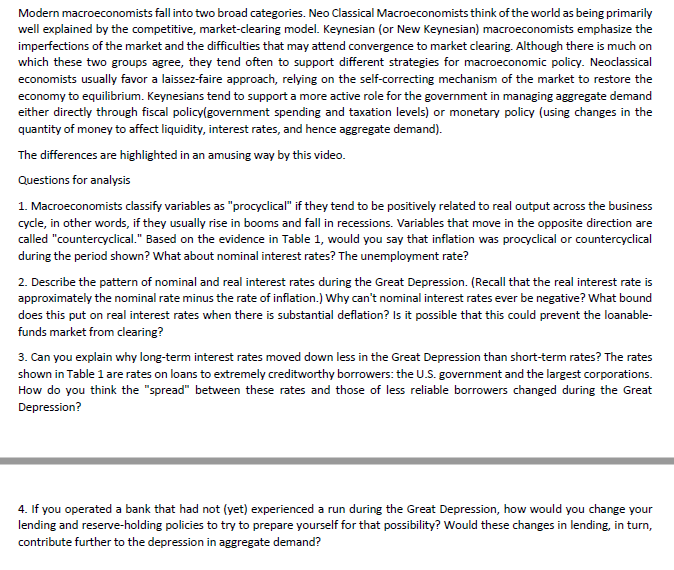
The Financial Crisis and Economic Downturn of 2008 and underwater: they owed more on their mortgages than their 2009 homes were worth. Many of these homeowners stopped In 2008 the U.S. economy experienced a financial crisis. paying their loans. The banks servicing the mortgages Several of the developments during this time were responded to the defaults by taking the houses away in reminiscent of events during the 1930s, causing many foreclosure procedures and then selling them off. The banks' observers to fear a severe downturn in economic activity and goal was to recoup whatever they could. The increase in the number of homes for sale, however, exacerbated the substantial rise in unemployment. downward spiral of housing prices. The story of the 2008 crisis begins a few years earlier with a A second repercussion was large losses at the various substantial boom in the housing market. The boom had financial institutions that owned mortgage-backed several sources. In part, it was fueled by low interest rates. As we saw in a previous case study in this chapter, the securities. In essence, by borrowing large sums to buy high- Federal Reserve lowered interest rates to historically low risk mortgages, these companies had bet that housing prices would keep rising; when this bet turned bad, they found levels in the aftermath of the recession of 2001. Low interest rates helped the economy recover, but by making it less themselves at or near the point of bankruptcy. Even healthy banks stopped trusting one another and avoided interbank expensive to get a mortgage and buy a home, they also lending, as it was hard to discern which institution would be contributed to a rise in housing prices. the next to go out of business. Because of these large losses In addition, developments in the mortgage market made it at financial institutions and the widespread fear and distrust, easier for subprime borrowers-those borrowers with higher the ability of the financial system to make loans even to risk of default based on their income and credit history-to creditworthy customers was impaired. get mortgages to buy homes. One of these developments A third repercussion was a substantial rise in stock market was securitization, the process by which a financial institution (a mortgage originator) makes loans and then volatility. Many companies rely on the financial system to get bundles them together into a variety of "mortgage-backed the resources they need for business expansion or to help securities." These mortgage-backed securities are then sold them manage their short-term cash flows. With the financial to other institutions (banks or insurance companies), which system less able to perform its normal operations, the profitability of many companies was called into question. may not fully appreciate the risks they are taking. Some economists blame insufficient regulation for these high-risk Because it was hard to know how bad things would get, stock loans. Others believe the problem was not too little market volatility reached levels not seen since the 1930s. regulation but the wrong kind: some government policies Higher volatility, in turn, lead to a fourth repercussion: a encouraged this high-risk lending to make the goal of decline in consumer confidence. In the midst of all the homeownership more attainable for low income families. uncertainty, households started putting off spending plans. Together, these forces drove EX durable goods. 1. ASregulation but the wrong kind: some government policies Higher volatility, in turn, lead to a fourth repercussion: a encouraged this high-risk lending to make the goal of decline in consumer confidence. In the midst of all the homeownership more attainable for low income families. uncertainty, households started putting off spending plans. Together, these forces drove up housing demand and Expenditure on durable goods, in particular, plummeted. As housing prices. From 1995 to 2006, average housing prices in a result of all these events, the economy experienced a large the United States more than doubled. contractionary shift in the IS curve. The high price of housing, however, proved unsustainable. The U.S government responded vigorously as the crisis From 2006 to 2008, housing prices nationwide fell about 20 unfolded. First, the Fed cut its target for the federal funds percent. Such price fluctuations should not necessarily be a rate from 5.25 percent in September 2007 to about zero in problem in a market economy. After all, price movements December 2008. Second, in an even more unusual move in are how markets equilibrate supply and demand. Moreover, October 2008, Congress appropriated $700 billion for the the price of housing in 2008 was merely a return to the level Treasury to use to rescue the financial system. Much of these that had prevailed in 2004. But, in this case, the price decline funds were used for equity injections into banks. That is, the led to a series of problematic repercussions. Treasury put funds into the banking system, which the banks could use to make loans; in exchange for these funds, the U.S. The first of these repercussions was a substantial rise in government became a part owner of these banks, at least mortgage defaults and home foreclosures. During the temporarily. The goal of the rescue (or "bailout," as it was housing boom, many homeowners had bought their homes sometimes called) was to stem the financial crisis on Wall with mostly borrowed money and minimal down payments. Street and prevent it from causing a depression on every When housing prices declined, these homeowners were other street in America.Case: The Great Depression The Broad Outline The Great Depression of the 1930s has affected the study of macroeconomics more than any other event in history. Indeed, the founding of macroeconomics as a separate discipline largely coincided with attempts to explain the Great Depression. It wasn't until the 1970s and 1980s that mainstream macroeconomics emerged from being dominated by theories of recession and depression. The most common association that the general public has with the Great Depression is the crash of the stock market that occurred in October of 1929. Stock prices did fall dramatically on the day of the crash and continued in a general downward trend for several years. However, the Great Depression was much more than a crash in financial markets. Although the crash had an impact on the Depression, it was less a cause of the Depression than a co-symptom of a collection of underlying problems. Both because of its magnitude as a social phenomenon and because of its impact on the development of macroeconomics, it is important to understand some basic facts about what happened during the Great Depression. In the words of Milton Friedman and Anna Schwartz, from their Monetary History of the United States, "The contraction from 1929 to 1933 was by far the most severe business-cycle contraction during the near-century of U.S. history we cover [1867-1960] and it may well have been the most severe in the whole of U.S. history. Though sharper and more prolonged in the United States than in most other countries, it was worldwide in scope and ranks as the most severe and widely diffused international contraction of modern times. U.S. net national product in current prices fell by more than one-half from 1929 to 1933; net national product in constant prices, by more than one-third; implicit prices [a broad index of prices across the economy], by more than one- quarter, and monthly wholesale prices, by more than one-third." The most commonly cited indicator of business cycles, the unemployment rate, rose from 3.2% of the labor force in 1929 to 24.9% in 1933. Unemployment fell to 14.3% in 1937, but then increased again to 19.0% in 1938 and was still 9.9% in 1941 before the military boom associated with World War II brought it down to 1.9% in 1943. Real gross national product (output of goods and services) per person did not until 1940 recover to the level it had achieved in 1929. As the quote from Friedman and Schwartz indicates, prices were falling steadily through the 10206 36 1 Table 1 statistic 1925 to 1910The most commonly cited indicator of business cycles, the unemployment rate, rose from 3.2% of the labor force in 1929 to 24.9% in 1933. Unemployment fell to 14.3% in 1937, but then increased again to 19.0% in 1938 and was still 9.9% in 1941 before the military boom associated with World War II brought it down to 1.9% in 1943. Real gross national product (output of goods and services) per person did not until 1940 recover to the level it had achieved in 1929. As the quote from Friedman and Schwartz indicates, prices were falling steadily through the 1930s as well. Table 1 summarizes some major macroeconomic statistics for the period 1925 to 1940. Table 1 per-capita real Interest rates GNP(1958 GNP deflator prices) (1958 = 100) (% per year) Prime Unemployment 4-6 3-month 30-year Growth Price Inflation |month Rate Level Treasury | corporate Rate level rate commercial bills bonds Year (9%) paper 1925 3.2 1,549 6.83% 51.9 1.37% 4.02% NA 4.50% 1926 1.8 1,619 4.52% 51.1 -1.54% 4.34% NA 4.40% 1927 3.3 1,594 -1.54% 50.0 -2.15% 4.11% NA 4.30% 1928 4.2 1,584 -0.63% 150.8 1.60% 4.85% NA 4.05% 1929 3.2 1,671 5.49% 50.6 -0.39% 5.85% NA 4.42% 1930 8.7 1,490 -10.83% 49.3 -2.57% 3.59% NA 4.40% 1931 15.9 1,364 -8.46% |44.8 -9.13% 2.64% 1.40% 4.10% 1932 23.9 1,154 -15.40% 40.2 -10.27% 2.73% 0.88% 4.70%1931 15.9 1,364 -8.46% 44.8 -9.13% 2.64% 1.40% 4.10% 1932 23.9 1,154 -15.40% 40.2 -10.27% 2.73% 0.88% 4.70% 1933 24.9 1 126 -2.43% 39.3 -2.24% 1.73% 0.52% 4.15% 1934 |21.7 1,220 8.35% 42.2 7.38% 1.02% 0.26% 3.99% 1935 20.1 1,331 9.10% 42.6 0.95% 0.75% 0.14% 3.50% 1936 16.9 1,506 13.15% 42.7 0.23% 0.75% 0.14% 3.20% 1937 14.3 1,576 4.65% 44 5 4.22% 0.94% 0.45% 3.08% 1938 19.0 1,484 -5.84% 43.9 -1.35% 0.81% 0.05% 3.00% 1939 17.2 1,598 7.68% 43.2 -1.59% 0.59% 0.02% 2.75% 1940 14.6 1,720 7.63% 43.9 1.62% 0.56% 0.01% 2.70% 1941 9.9 1,977 14.94% 47.2 7.52% 0.53% 0.13% 2.65% Source: Historical Statistics of the United States, Colonial Times to 1970 (Washington, DC: United States Bureau of the Census, 1975). Financial markets, banks, and the real economy The stock-market problems-stock prices lost about three-quarters of their value between October 1929 and 1933-had significant repercussions for the banking system, which in turn affected the economy. At that time, it was common for investors to borrow from banks to purchase stocks "on the margin," using the value of the stocks as collateral on the loans. (Such margin loans are now much more carefully restricted.) A sudden collapse in stock prices reduced the value of the collateral, causing banks to make "margin calls," in which investors were asked to either repay their loans or provide additional collateral. In order to try to obtain enough liquidity to do one of these things, many investors attempted to sell their stock, which of course drove stock prices down even more rapidly in a self-reinforcing spiral. Since many customers were not able to get enough liquidity to make their margin calls, defaults on bank loans soared, leading to a loss in confidence in the banking system. Meanwhile, as the economy soured, other bank loans were beginning to lookSince many customers were not able to get enough liquidity to make their margin calls, defaults on bank loans soared, leading to a loss in confidence in the banking system. Meanwhile, as the economy soured, other bank loans were beginning to look less safe as well, raising the prospect of significant bank failures. At that time, bank deposits were not insured, so that if a bank was destined to fail, those depositors who were able to get their money out before it actually closed would be paid in full, while others would get their money back only in part and only after a delay (because the bank's remaining assets would have to be sold to determine how much could be paid). This gave depositors a very strong incentive to race to the withdrawal window to be first to get their money, starting a "run on the bank" any time a bank was thought to be in difficulty. However, banks-then as now-keep only a small amount of depositors' money in the form of reserves (vault cash and readily available deposits at the Federal Reserve Banks). The rest is lent to customers to earn interest or used to purchase interest-bearing securities. A bank run can use up a bank's reserves very quickly, forcing it to either (1) sell off some of its loans and securities very quickly to get cash, (2) borrow cash from someone, perhaps the Federal Reserve, or (3) close down, at least temporarily. The securities (and even loans) of an individual bank may be quite "liquid" (commonly traded, so it is easy to find a willing buyer) during normal times, but when a whiff of crisis is in the air there are far more sellers in the market than buyers. If a bank is forced to sell into a frightened market, they may get very low "fire-sale" prices for the assets they are able to sell. If they have to sell assets at a loss, this worsens the bank's financial situation and may push it over the edge into insolvency, where the bank's liabilities exceed the value of its assets-the bank may fail. When the Federal Reserve System was founded in 1913, its principal mission was to provide an "elastic currency" by actingWhen the Federal Reserve System was founded in 1913, its principal mission was to provide an "elastic currency" by acting as a "lender of last resort" for banks, lending to them through the "discount window" by purchasing their loans and securities for cash when the banks faced possible runs and needed liquidity. However, during the bank crises of the Great Depression the Fed put such strict rules on the kinds of assets that it would buy that emergency borrowing from the Fed failed to avert bank runs. Between 1929 and 1933, bank failures were so wide-spread that the number of commercial banks operating in the United States fell by over one-third. The extraordinarily high rate of unemployment of the economy's labor resources was mirrored by underutilization of its capital. Industrial production declined by about half from 1929-33, leaving many factories, mines, and shops shut down and many others operating at far below their capacity. The economy had entered a vicious circle: aggregate demand for goods and services was so low that firms could not sell as much output as they could produce under full utilization of resources. Because production and employment were so low, households' incomes contracted severely so that they could not afford to buy many goods, which in turn kept aggregate demand depressed. The apparent failure of the market system to coordinate households' and firms' economic decisions in an efficient way directly contradicted the fundamental efficiency implications of classical economics, which was based on the perfectly competitive model of general equilibrium. Moreover, the source of this coordination failure did not seem to lie in any of the classical causes of market failure such as externalities, public goods, or monopoly. Rather, the price system seemed to be ineffective at providing the appropriate signals to clear the markets for products and resources. Markets did not seem to clear; demand was apparently not equal to supply. Explaining the nature of this failure was the task attempted by John Maynard Keynes, a brilliant but maverick British economist, in The General Theory of Employment, Interest and Money, published in 1936. Keynes focused on the key role played by aggregate demand in determining the overall level of economic activity in an economy. The refinement of models based on Keynes's insights and of alternative models exploring the relationships among economic aggregates led to the development of the discipline of macroeconomics. Modern macroeconomists fall into two broad categories. Neo Classical Macroeconomists think of the world as being primarily well explained by the competitive, market-clearing model. Keynesian (or New Keynesian) macroeconomists emphasize the imperfections of the market and the difficulties that may attend convergence to market clearing. Although there is much on which these two groups agree, they tend often to support different strategies for macroeconomic policy. Neoclassical economists usually favor a laissez-faire approach, relying on the self-correcting mechanism of the market to restore the economy to equilibrium. Keynesians tend to support a more active role for the government in managing aggregate demand either directly through fiscal policy(government spending and taxation levels) or monetary policy (using changes in the quantity of money to affect liquidity, interest rates, and hence aggregate demand).Modern macroeconomists fall into two broad categories. Neo Classical Macroeconomists think of the world as being primarily well explained by the competitive, market-clearing model. Keynesian (or New Keynesian) macroeconomists emphasize the imperfections of the market and the difficulties that may attend convergence to market clearing. Although there is much on which these two groups agree, they tend often to support different strategies for macroeconomic policy. Neoclassical economists usually favor a laissez-faire approach, relying on the self-correcting mechanism of the market to restore the economy to equilibrium. Keynesians tend to support a more active role for the government in managing aggregate demand either directly through fiscal policy(government spending and taxation levels) or monetary policy (using changes in the quantity of money to affect liquidity, interest rates, and hence aggregate demand). The differences are highlighted in an amusing way by this video. Questions for analysis 1. Macroeconomists classify variables as "procyclical" if they tend to be positively related to real output across the business cycle, in other words, if they usually rise in booms and fall in recessions. Variables that move in the opposite direction are called "countercyclical." Based on the evidence in Table 1, would you say that inflation was procyclical or countercyclical during the period shown? What about nominal interest rates? The unemployment rate? 2. Describe the pattern of nominal and real interest rates during the Great Depression. (Recall that the real interest rate is approximately the nominal rate minus the rate of inflation.) Why can't nominal interest rates ever be negative? What bound does this put on real interest rates when there is substantial deflation? Is it possible that this could prevent the loanable- funds market from clearing? 3. Can you explain why long-term interest rates moved down less in the Great Depression than short-term rates? The rates shown in Table 1 are rates on loans to extremely creditworthy borrowers: the U.S. government and the largest corporations. How do you think the "spread" between these rates and those of less reliable borrowers changed during the Great Depression? 4. If you operated a bank that had not (yet) experienced a run during the Great Depression, how would you change your lending and reserve-holding policies to try to prepare yourself for that possibility? Would these changes in lending, in turn, contribute further to the depression in aggregate demand
