

Question
The firm in question is Nike. Refer to Tables A-1 through A-5 in Appendix II of the text for the operational definitions of and formulas
The firm in question is Nike.
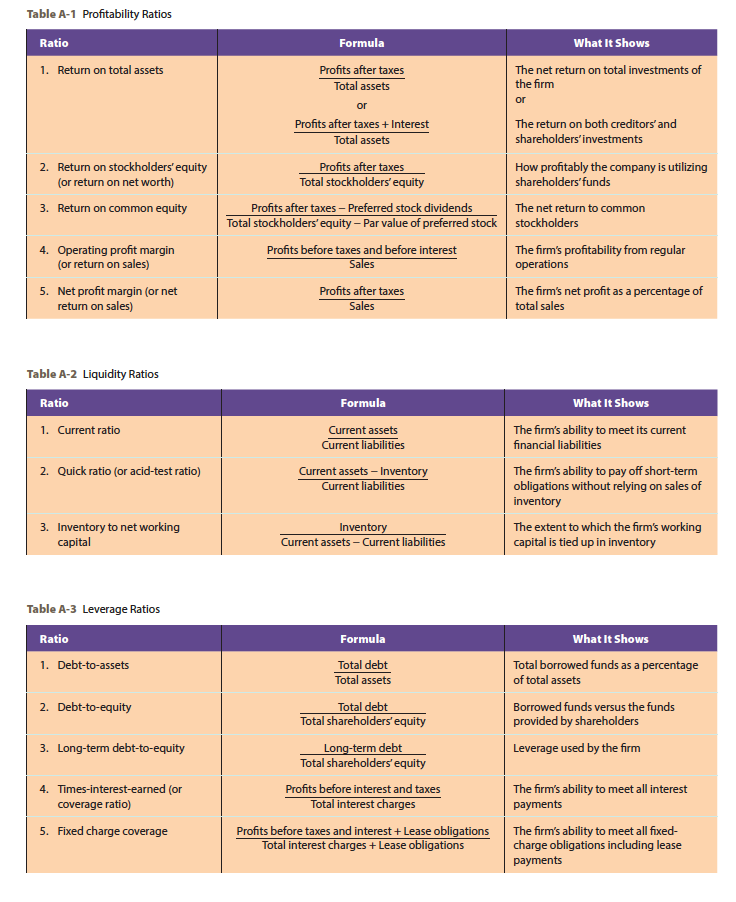
Refer to Tables A-1 through A-5 in Appendix II of the text for the operational definitions of and formulas for numerous common financial ratios, including profitability, liquidity, leverage, activity, and shareholders' return. Using these formulas, complete at least one ratio from each of the five categories, though you may apply as many of the ratios for which you can find the required information in the firm's financial reports. On your calculations page, specify which formulas you are solving.
In an assessment of approximately 750 words, address the following:
- Determine which of the ratios provide the most key insights into the firm's current level of performance. How can you assess whether the results of your calculations are positive or negative? Explain which of the ratios give you reason to be concerned with the organization's current strategy and why.
- The Organizational and Operational Plans assignment references the possible benefits and risks of forming a strategic alliance. What would be the risks of forming a strategic alliance in terms of the firm's profitability ratios? Which of those five ratios is most likely to reveal immediate information for analysis of the alliance's effectiveness?
- Considering today's financial climate, how likely is it that the organization could acquire the capital necessary to support an aggressive value-enhancement strategy? From where would that capital originate? Compared to current interest rates, what do you believe is a realistic interest rate the firm might incur? Which of the liquidity ratios will be impacted by the influx of capital, if borrowed?
Submit your calculations with your written response.
Table A-1 Profitability Ratios Ratio 1. Return on total assets 2. Return on stockholders' equity (or return on net worth) 3. Return on common equity Formula What It Shows Profits after taxes The net return on total investments of Total assets the firm or or Profits after taxes + Interest The return on both creditors' and Total assets shareholders'investments Profits after taxes How profitably the company is utilizing Total stockholders' equity shareholders'funds Profits after taxes Preferred stock dividends The net return to common Total stockholders' equity - Par value of preferred stock stockholders Profits before taxes and before interest The firm's profitability from regular Sales operations Profits after taxes The firm's net profit as a percentage of Sales total sales 4. Operating profit margin (or return on sales) 5. Net profit margin (or net return on sales) Table A-2 Liquidity Ratios Ratio 1. Current ratio Formula Current assets Current liabilities Current assets Inventory Current liabilities 2. Quick ratio (or acid-test ratio) What It Shows The firm's ability to meet its current financial liabilities The firm's ability to pay off short-term obligations without relying on sales of inventory The extent to which the firm's working capital is tied up in inventory 3. Inventory to net working capital Inventory Current assets - Current liabilities Table A-3 Leverage Ratios Ratio 1. Debt-to-assets What It Shows Total borrowed funds as a percentage of total assets Borrowed funds versus the funds provided by shareholders Leverage used by the firm 2. Debt-to-equity Formula Total debt Total assets Total debt Total shareholders' equity Long-term debt Total shareholders' equity Profits before interest and taxes Total interest charges Profits before taxes and interest +Lease obligations Total interest charges + Lease obligations 3. Long-term debt-to-equity 4. Times-interest-earned (or coverage ratio) 5. Fixed charge coverage The firm's ability to meet all interest payments The firm's ability to meet all fixed- charge obligations including lease payments Table A-1 Profitability Ratios Ratio 1. Return on total assets 2. Return on stockholders' equity (or return on net worth) 3. Return on common equity Formula What It Shows Profits after taxes The net return on total investments of Total assets the firm or or Profits after taxes + Interest The return on both creditors' and Total assets shareholders'investments Profits after taxes How profitably the company is utilizing Total stockholders' equity shareholders'funds Profits after taxes Preferred stock dividends The net return to common Total stockholders' equity - Par value of preferred stock stockholders Profits before taxes and before interest The firm's profitability from regular Sales operations Profits after taxes The firm's net profit as a percentage of Sales total sales 4. Operating profit margin (or return on sales) 5. Net profit margin (or net return on sales) Table A-2 Liquidity Ratios Ratio 1. Current ratio Formula Current assets Current liabilities Current assets Inventory Current liabilities 2. Quick ratio (or acid-test ratio) What It Shows The firm's ability to meet its current financial liabilities The firm's ability to pay off short-term obligations without relying on sales of inventory The extent to which the firm's working capital is tied up in inventory 3. Inventory to net working capital Inventory Current assets - Current liabilities Table A-3 Leverage Ratios Ratio 1. Debt-to-assets What It Shows Total borrowed funds as a percentage of total assets Borrowed funds versus the funds provided by shareholders Leverage used by the firm 2. Debt-to-equity Formula Total debt Total assets Total debt Total shareholders' equity Long-term debt Total shareholders' equity Profits before interest and taxes Total interest charges Profits before taxes and interest +Lease obligations Total interest charges + Lease obligations 3. Long-term debt-to-equity 4. Times-interest-earned (or coverage ratio) 5. Fixed charge coverage The firm's ability to meet all interest payments The firm's ability to meet all fixed- charge obligations including lease paymentsStep by Step Solution
There are 3 Steps involved in it
Step: 1

Get Instant Access to Expert-Tailored Solutions
See step-by-step solutions with expert insights and AI powered tools for academic success
Step: 2

Step: 3
Ace Your Homework with AI
Get the answers you need in no time with our AI-driven, step-by-step assistance
Get Started
Forex Analysis And Strategies For Day Traders Profitable Investing With Currency Swaps Hedges And Scalps For Both Beginning And Advanced Traders
Authors: Steve Alkandros
1st Edition
1545117039, 978-1545117033