Answered step by step
Verified Expert Solution
Question
1 Approved Answer
the first 8 pictures are just resources. you might not need all 8 depending on the question My question is Statement of shareholders equity
the first 8 pictures are just resources. you might not need all 8 depending on the question
My question is " Statement of shareholders equity shows that Southwest reissued some treasury shares to its employees. Can you tell whether these shares were reissued at a higher or lower price than the price Southwest originally purchased them at? Does the difference between original purchase price and the reissue price represent a real profit or loss for employees?"
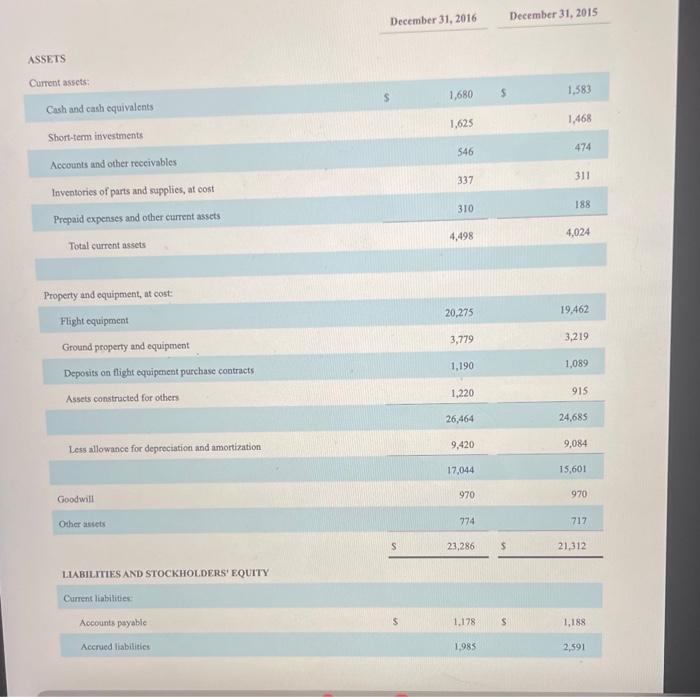
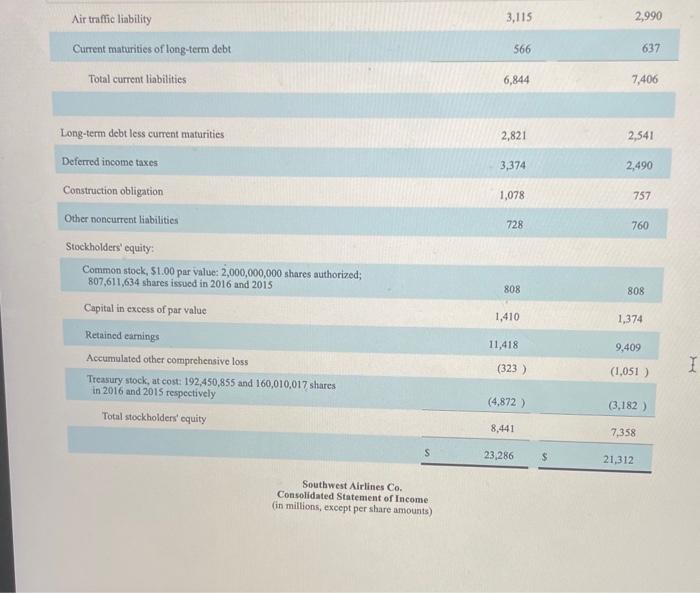
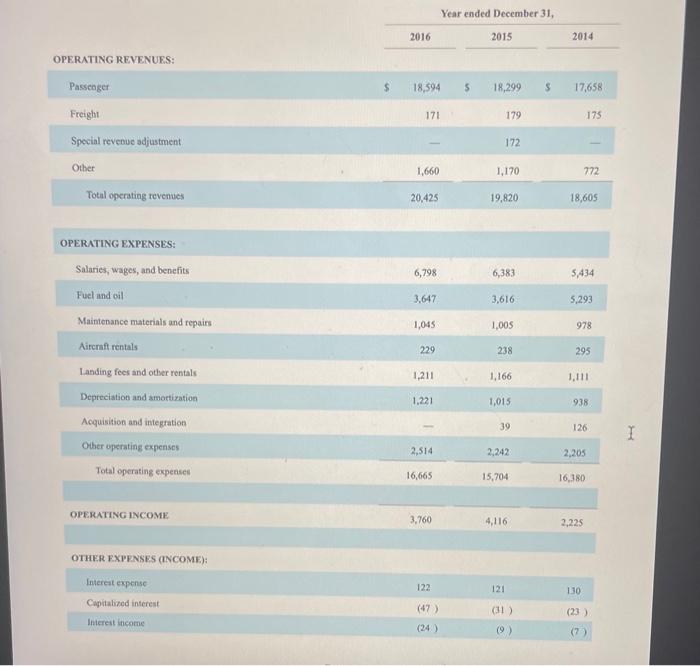
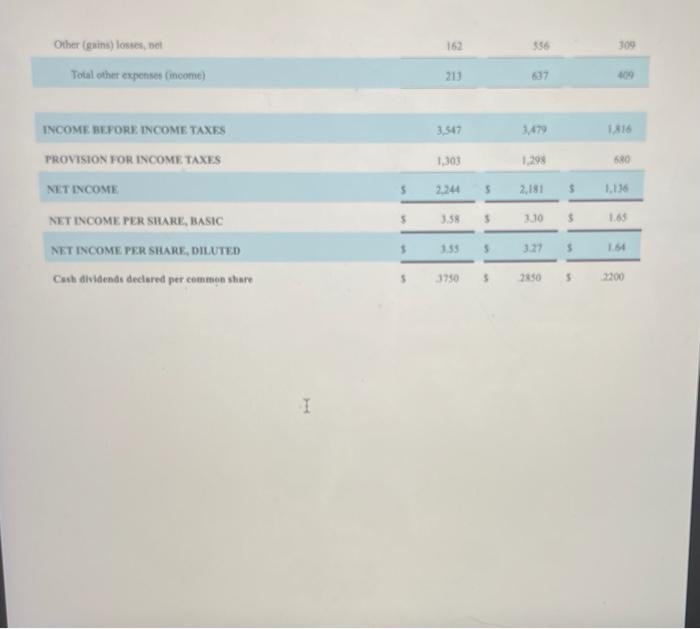
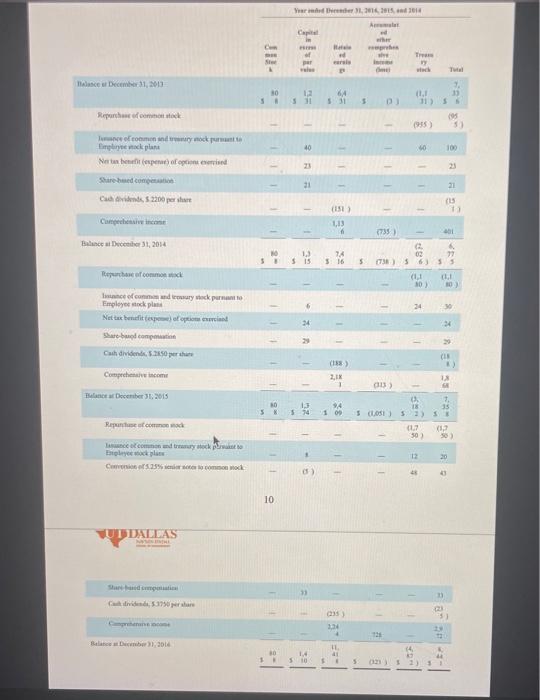
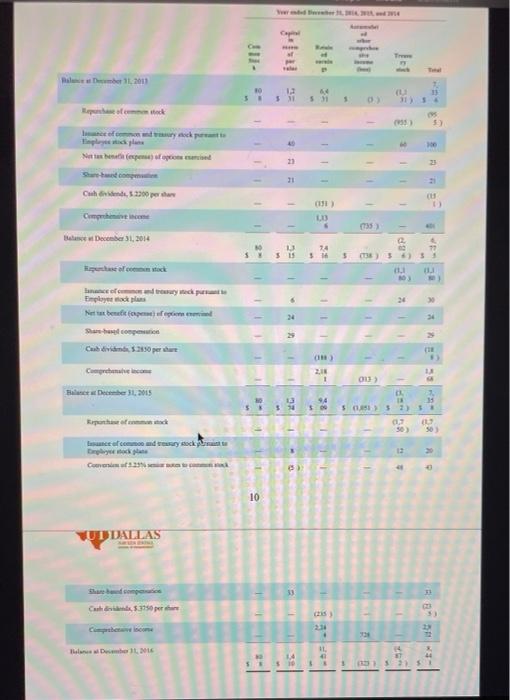
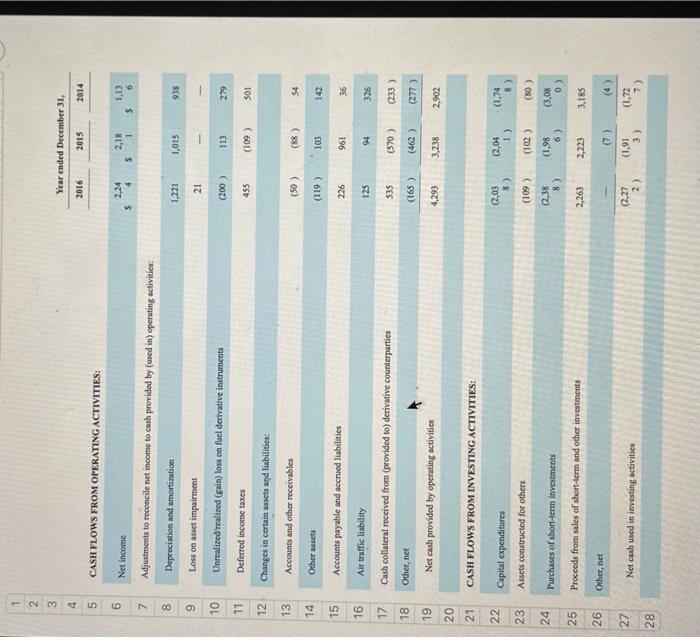
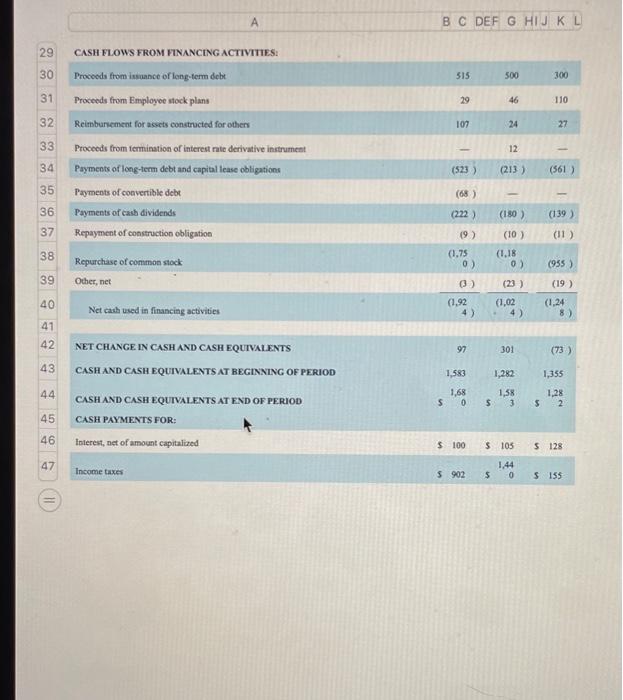
ASSETS Current assets: Cash and cash equivalents Short-term investments Accounts and other receivables Inventories of parts and supplies, at cost Prepaid expenses and other current assets Total current assets Property and equipment, at cost: Flight equipment Ground property and equipment Deposits on flight equipment purchase contracts Assets constructed for others Less allowance for depreciation and amortization Goodwill Other assets LIABILITIES AND STOCKHOLDERS' EQUITY Current liabilities: Accounts payable Accrued liabilities December 31, 2016 1,680 1,625 546 S 337 310 4,498 20,275 3,779 1,190 1,220 26,464 9,420 17,044 970 774 23,286 1,178: 1,985 S S S December 31, 2015 1,583 1,468 474 311 188 4,024 19,462 3,219 1,089 915 24,685 9,084 15,601 970 717 21,312 1,188 2,591 Air traffic liability Current maturities of long-term debt Total current liabilities Long-term debt less current maturities Deferred income taxes Construction obligation Other noncurrent liabilities Stockholders' equity: Common stock, $1.00 par value: 2,000,000,000 shares authorized; 807,611,634 shares issued in 2016 and 2015 Capital in excess of par value Retained earnings Accumulated other comprehensive loss Treasury stock, at cost: 192,450,855 and 160,010,017 shares in 2016 and 2015 respectively Total stockholders' equity Southwest Airlines Co. Consolidated Statement of Income (in millions, except per share amounts) 3,115 566 6,844 2,821 3,374 1,078 728 808 1,410 11,418 (323) (4,872) 8,441 23,286 2,990 637 7,406 2,541 2,490 757 760 808 1,374 9,409 (1,051) (3,182) 7,358 21,312 I OPERATING REVENUES: Passenger Freight Special revenue adjustment Other Total operating revenues OPERATING EXPENSES: Salaries, wages, and benefits Fuel and oil Maintenance materials and repairs Aircraft rentals Landing fees and other rentals Depreciation and amortization Acquisition and integration Other operating expenses Total operating expenses OPERATING INCOME OTHER EXPENSES (INCOME): Interest expense Capitalized interest Interest income $ Year ended December 31, 2015 2016 18,594 $ 171 1,660 20,425 6,798 3,647 1,045 229 1,211 1,221 2,514 16,665 3,760 122 (47) (24) 18,299 179 172 1,170 19,820 6,383 3,616 1,005 238 1,166 1,015 39 2,242 15,704 4,116 121 (31) (9) 2014 17,658 175 772 18,605 5,434 5,293 978 295 1,111 938 126 2,205 16,380 2,225 1.30 (23) (7) I Other (gains) losses, net Total other expenses (income) INCOME BEFORE INCOME TAXES PROVISION FOR INCOME TAXES NET INCOME NET INCOME PER SHARE, BASIC NET INCOME PER SHARE, DILUTED Cash dividends declared per common share I S $ S S 162 213 3,547 1,303 2,244 S 3.58 S 3.55 S 3750 S 356 637 3,479 1,298 2,181 3.30 3.27 2850 $ $ S S 309 1,816 680 1,136 1.65 2200 Balance or December 31, 2013 Repurchase of common stock Juance of common and tremary mock purnt to Employee sock plant Ne tax benefit (espense) of options exercised Share-based compensation Cach dividends, S.2200 per share Comprehensive income Balance at December 31, 2014 Tepunchant of common stick Iance of common and treasury stock purnant to Employee stock plans Net tax benefit (expe) of options exerciand Share-based compation Cash dividends, 5.2850 perse Comprehensive incom Balance at December 31, 2015 Repurchase of common stock Jasuance of common and treasury stock paket to Epleyee stock plass Conversion of 5.25% senior notes to common stock UDDALLAS NYHE Comprehensive come Balance at December 31, 2014 C Stee LELLE - Your Binder 31, 2016, 2015, and 2014 Amate Capital in emm Ref H ether wwwprebes sive of par Tram vy incom earais P One stick Tul 12 64 5:31 S (1.1 33 5 31 (955) 10 T 111 40 23 21 13 74 SB S 15 3 16 (151) 1,13 f (188) 2,18 T 13 94 574 1 09 9 14 $ 10 L (235) 3,24 4 11. 41 D) IE 11 (313) $ (1051) 726 (32) 40 $11 1111 111 RX A 1 F (735) 02 27 S (738) S 6) 55 (1,1) (1.1 10 (2 (4 30.) 24 1 1 E DR (3. 18 30) 12 2) S (95 100 23 21 (15 11 2 401 (23 R 20 6. 29 (IN 18 7. 35 SE (1,3 50) 20 43 $) Balance at Dember 11, 2011 Repurchase of common stock lance of common and try stock pumant to Employee stick plan Net tas benefit (expense) of opcions esercised Share-based computin Cash dividends, 52200 pers Comprove income Balance December 31, 2014 of costock lanance of common and treasury stock pursuant Employer mock plans Net at benefit (pen) of epos exi Share-based compensation Cash dividends, 1.2850 per Comprehensive income Balance at December 31, 2015 Rephase of common tack Issuance of common and treasury stock p Explock pla Conversi 3.23% si te UT DALLAS Share band competics Cadis, 5.3750 per Compete income Belanes al Desember 11, 2016 k -11 OF Capital 2- | || www per vala 12 38 $31 531 1111 35 11 13 1 10 SSRS 21 232 Bibale 24 pe ()) P PV (191) K 11-5 0-1 20 11182 NO 2,18 1 S % (215) 234 . A 11, S (...) Tree (955) 1 (735) 74 77 $16 S (138) $ 4) 35 (1.1 (1) BPI 80 3 24 20 33 WI (95 41 5.) 000 23 (15) 1) 401 4 MO *** 53 (13) D $(185) $ 2) SA 0,7 50) 503 12 20 24 CO P 31 B33- 28 728 (33) 5 21 51 222 23 2290 CASH FLOWS FROM OPERATING ACTIVITIES: Net income 7 Adjustments to reconcile net income to cash provided by (used in) operating activities: Depreciation and amortization Loss on asset impairment Unrealized realized (gain) loss on fuel derivative instruments Deferred income taxes Changes in certain assets and liabilities: Accounts and other receivables Other assets Accounts payable and accrued liabilities Air traffic liability Cash collateral received from (provided to) derivative counterparties Other, net Net cash provided by operating activities CASH FLOWS FROM INVESTING ACTIVITIES: Capital expenditures Assets constructed for others Purchases of short-term investments Proceeds from sales of short-term and other investments Other, net Net cash used in investing activities 8 9 10 11 12 13 14 15 16 17 18 19 20 21 24 25 26 123 27 28 5 6 Year ended December 31, 2016 2015 2014 2,24 2,18 1,13 $ 6 $ 1 1,221 1,015 938 21 (200) 113 279 455 (109) 501 (50) (88) 54 (119) 103 142 226 961 36 125 94 326 535 (570) (233) (165) (462) (277) 4,293 (2,03 8) (109) (2,38 2,263 - (2,27 8) 2) 3,238 (2,04 1) (102) (1,98 2,223 6) (7) (1,91 3) 2,902 (1.74 8) (80) (3,08 3,185 0) (4) (1,72 7) 29 30 31 32 33 34 35 36 37 38 39 40 41 42 43 44 45 46 47 (11 A CASH FLOWS FROM FINANCING ACTIVITIES: Proceeds from issuance of long-term debt Proceeds from Employee stock plans Reimbursement for assets constructed for others Proceeds from termination of interest rate derivative instrument Payments of long-term debt and capital lease obligations Payments of convertible debt Payments of cash dividends Repayment of construction obligation Repurchase of common stock Other, net Net cash used in financing activities NET CHANGE IN CASH AND CASH EQUIVALENTS CASH AND CASH EQUIVALENTS AT BEGINNING OF PERIOD CASH AND CASH EQUIVALENTS AT END OF PERIOD CASH PAYMENTS FOR: Interest, net of amount capitalized Income taxes BC DEF G HIJ K L 515 500 300 29 46 110 107 24 27 12 1 (523) (213) (561) - (68) (222) (180) (139) (9) (10) (11) (955) (19) (1,75 0) (1,92 4) 97 1,583 1,68 S 0 $100 $ 902 (1,18 0) (23) (1,02 4) 301 1,282 1,58 $ 3 $ 105 1,44 $ 0 (1,24 8) (73) 1,355 1,28 $ 2 $ 128 $ 155 ASSETS Current assets: Cash and cash equivalents Short-term investments Accounts and other receivables Inventories of parts and supplies, at cost Prepaid expenses and other current assets Total current assets Property and equipment, at cost: Flight equipment Ground property and equipment Deposits on flight equipment purchase contracts Assets constructed for others Less allowance for depreciation and amortization Goodwill Other assets LIABILITIES AND STOCKHOLDERS' EQUITY Current liabilities: Accounts payable Accrued liabilities December 31, 2016 1,680 1,625 546 S 337 310 4,498 20,275 3,779 1,190 1,220 26,464 9,420 17,044 970 774 23,286 1,178: 1,985 S S S December 31, 2015 1,583 1,468 474 311 188 4,024 19,462 3,219 1,089 915 24,685 9,084 15,601 970 717 21,312 1,188 2,591 Air traffic liability Current maturities of long-term debt Total current liabilities Long-term debt less current maturities Deferred income taxes Construction obligation Other noncurrent liabilities Stockholders' equity: Common stock, $1.00 par value: 2,000,000,000 shares authorized; 807,611,634 shares issued in 2016 and 2015 Capital in excess of par value Retained earnings Accumulated other comprehensive loss Treasury stock, at cost: 192,450,855 and 160,010,017 shares in 2016 and 2015 respectively Total stockholders' equity Southwest Airlines Co. Consolidated Statement of Income (in millions, except per share amounts) 3,115 566 6,844 2,821 3,374 1,078 728 808 1,410 11,418 (323) (4,872) 8,441 23,286 2,990 637 7,406 2,541 2,490 757 760 808 1,374 9,409 (1,051) (3,182) 7,358 21,312 I OPERATING REVENUES: Passenger Freight Special revenue adjustment Other Total operating revenues OPERATING EXPENSES: Salaries, wages, and benefits Fuel and oil Maintenance materials and repairs Aircraft rentals Landing fees and other rentals Depreciation and amortization Acquisition and integration Other operating expenses Total operating expenses OPERATING INCOME OTHER EXPENSES (INCOME): Interest expense Capitalized interest Interest income $ Year ended December 31, 2015 2016 18,594 $ 171 1,660 20,425 6,798 3,647 1,045 229 1,211 1,221 2,514 16,665 3,760 122 (47) (24) 18,299 179 172 1,170 19,820 6,383 3,616 1,005 238 1,166 1,015 39 2,242 15,704 4,116 121 (31) (9) 2014 17,658 175 772 18,605 5,434 5,293 978 295 1,111 938 126 2,205 16,380 2,225 1.30 (23) (7) I Other (gains) losses, net Total other expenses (income) INCOME BEFORE INCOME TAXES PROVISION FOR INCOME TAXES NET INCOME NET INCOME PER SHARE, BASIC NET INCOME PER SHARE, DILUTED Cash dividends declared per common share I S $ S S 162 213 3,547 1,303 2,244 S 3.58 S 3.55 S 3750 S 356 637 3,479 1,298 2,181 3.30 3.27 2850 $ $ S S 309 1,816 680 1,136 1.65 2200 Balance or December 31, 2013 Repurchase of common stock Juance of common and tremary mock purnt to Employee sock plant Ne tax benefit (espense) of options exercised Share-based compensation Cach dividends, S.2200 per share Comprehensive income Balance at December 31, 2014 Tepunchant of common stick Iance of common and treasury stock purnant to Employee stock plans Net tax benefit (expe) of options exerciand Share-based compation Cash dividends, 5.2850 perse Comprehensive incom Balance at December 31, 2015 Repurchase of common stock Jasuance of common and treasury stock paket to Epleyee stock plass Conversion of 5.25% senior notes to common stock UDDALLAS NYHE Comprehensive come Balance at December 31, 2014 C Stee LELLE - Your Binder 31, 2016, 2015, and 2014 Amate Capital in emm Ref H ether wwwprebes sive of par Tram vy incom earais P One stick Tul 12 64 5:31 S (1.1 33 5 31 (955) 10 T 111 40 23 21 13 74 SB S 15 3 16 (151) 1,13 f (188) 2,18 T 13 94 574 1 09 9 14 $ 10 L (235) 3,24 4 11. 41 D) IE 11 (313) $ (1051) 726 (32) 40 $11 1111 111 RX A 1 F (735) 02 27 S (738) S 6) 55 (1,1) (1.1 10 (2 (4 30.) 24 1 1 E DR (3. 18 30) 12 2) S (95 100 23 21 (15 11 2 401 (23 R 20 6. 29 (IN 18 7. 35 SE (1,3 50) 20 43 $) Balance at Dember 11, 2011 Repurchase of common stock lance of common and try stock pumant to Employee stick plan Net tas benefit (expense) of opcions esercised Share-based computin Cash dividends, 52200 pers Comprove income Balance December 31, 2014 of costock lanance of common and treasury stock pursuant Employer mock plans Net at benefit (pen) of epos exi Share-based compensation Cash dividends, 1.2850 per Comprehensive income Balance at December 31, 2015 Rephase of common tack Issuance of common and treasury stock p Explock pla Conversi 3.23% si te UT DALLAS Share band competics Cadis, 5.3750 per Compete income Belanes al Desember 11, 2016 k -11 OF Capital 2- | || www per vala 12 38 $31 531 1111 35 11 13 1 10 SSRS 21 232 Bibale 24 pe ()) P PV (191) K 11-5 0-1 20 11182 NO 2,18 1 S % (215) 234 . A 11, S (...) Tree (955) 1 (735) 74 77 $16 S (138) $ 4) 35 (1.1 (1) BPI 80 3 24 20 33 WI (95 41 5.) 000 23 (15) 1) 401 4 MO *** 53 (13) D $(185) $ 2) SA 0,7 50) 503 12 20 24 CO P 31 B33- 28 728 (33) 5 21 51 222 23 2290 CASH FLOWS FROM OPERATING ACTIVITIES: Net income 7 Adjustments to reconcile net income to cash provided by (used in) operating activities: Depreciation and amortization Loss on asset impairment Unrealized realized (gain) loss on fuel derivative instruments Deferred income taxes Changes in certain assets and liabilities: Accounts and other receivables Other assets Accounts payable and accrued liabilities Air traffic liability Cash collateral received from (provided to) derivative counterparties Other, net Net cash provided by operating activities CASH FLOWS FROM INVESTING ACTIVITIES: Capital expenditures Assets constructed for others Purchases of short-term investments Proceeds from sales of short-term and other investments Other, net Net cash used in investing activities 8 9 10 11 12 13 14 15 16 17 18 19 20 21 24 25 26 123 27 28 5 6 Year ended December 31, 2016 2015 2014 2,24 2,18 1,13 $ 6 $ 1 1,221 1,015 938 21 (200) 113 279 455 (109) 501 (50) (88) 54 (119) 103 142 226 961 36 125 94 326 535 (570) (233) (165) (462) (277) 4,293 (2,03 8) (109) (2,38 2,263 - (2,27 8) 2) 3,238 (2,04 1) (102) (1,98 2,223 6) (7) (1,91 3) 2,902 (1.74 8) (80) (3,08 3,185 0) (4) (1,72 7) 29 30 31 32 33 34 35 36 37 38 39 40 41 42 43 44 45 46 47 (11 A CASH FLOWS FROM FINANCING ACTIVITIES: Proceeds from issuance of long-term debt Proceeds from Employee stock plans Reimbursement for assets constructed for others Proceeds from termination of interest rate derivative instrument Payments of long-term debt and capital lease obligations Payments of convertible debt Payments of cash dividends Repayment of construction obligation Repurchase of common stock Other, net Net cash used in financing activities NET CHANGE IN CASH AND CASH EQUIVALENTS CASH AND CASH EQUIVALENTS AT BEGINNING OF PERIOD CASH AND CASH EQUIVALENTS AT END OF PERIOD CASH PAYMENTS FOR: Interest, net of amount capitalized Income taxes BC DEF G HIJ K L 515 500 300 29 46 110 107 24 27 12 1 (523) (213) (561) - (68) (222) (180) (139) (9) (10) (11) (955) (19) (1,75 0) (1,92 4) 97 1,583 1,68 S 0 $100 $ 902 (1,18 0) (23) (1,02 4) 301 1,282 1,58 $ 3 $ 105 1,44 $ 0 (1,24 8) (73) 1,355 1,28 $ 2 $ 128 $ 155
Step by Step Solution
There are 3 Steps involved in it
Step: 1

Get Instant Access to Expert-Tailored Solutions
See step-by-step solutions with expert insights and AI powered tools for academic success
Step: 2

Step: 3

Ace Your Homework with AI
Get the answers you need in no time with our AI-driven, step-by-step assistance
Get Started


