

Answered step by step
Verified Expert Solution
Question
1 Approved Answer
The first image is WorldBank_Metadata_Countries.csv, the second one is WorldBank_Population.csv. Please use Python A B C D E F Country Code Region Income Group Special
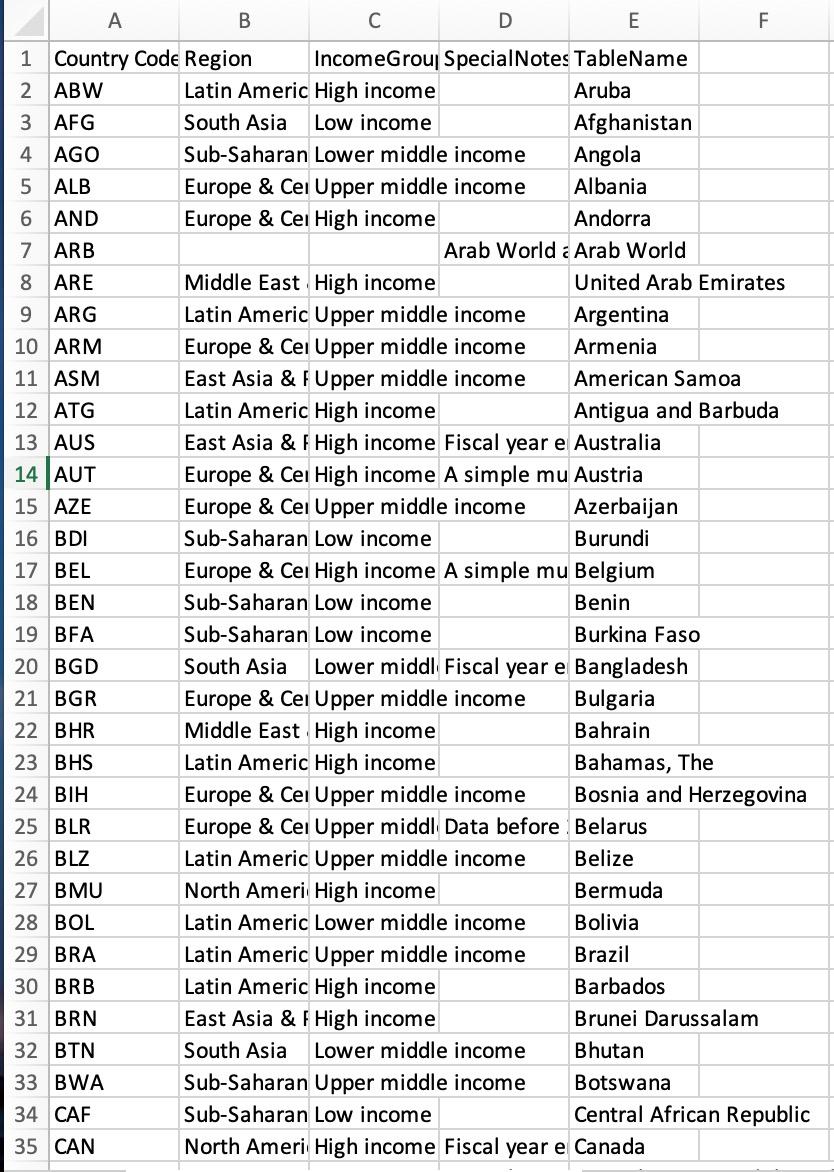
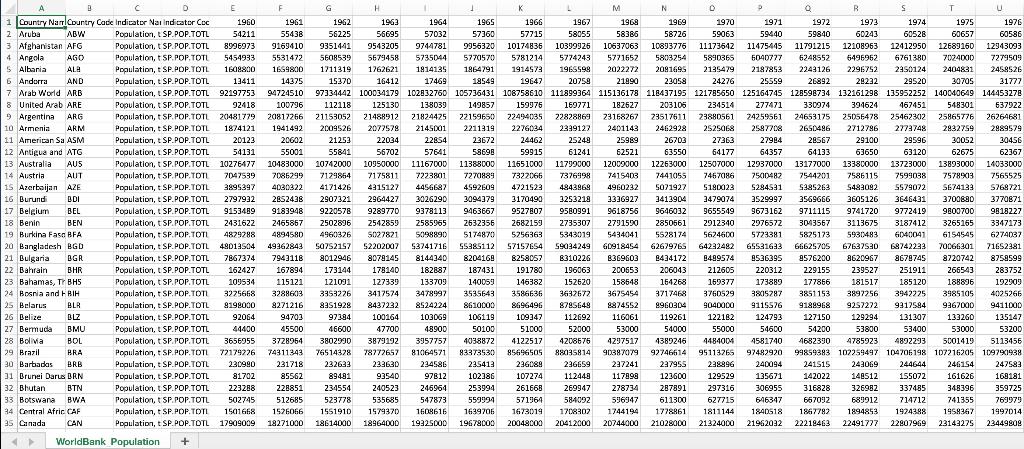
 The first image is "WorldBank_Metadata_Countries.csv", the second one is "WorldBank_Population.csv".
Please use Python
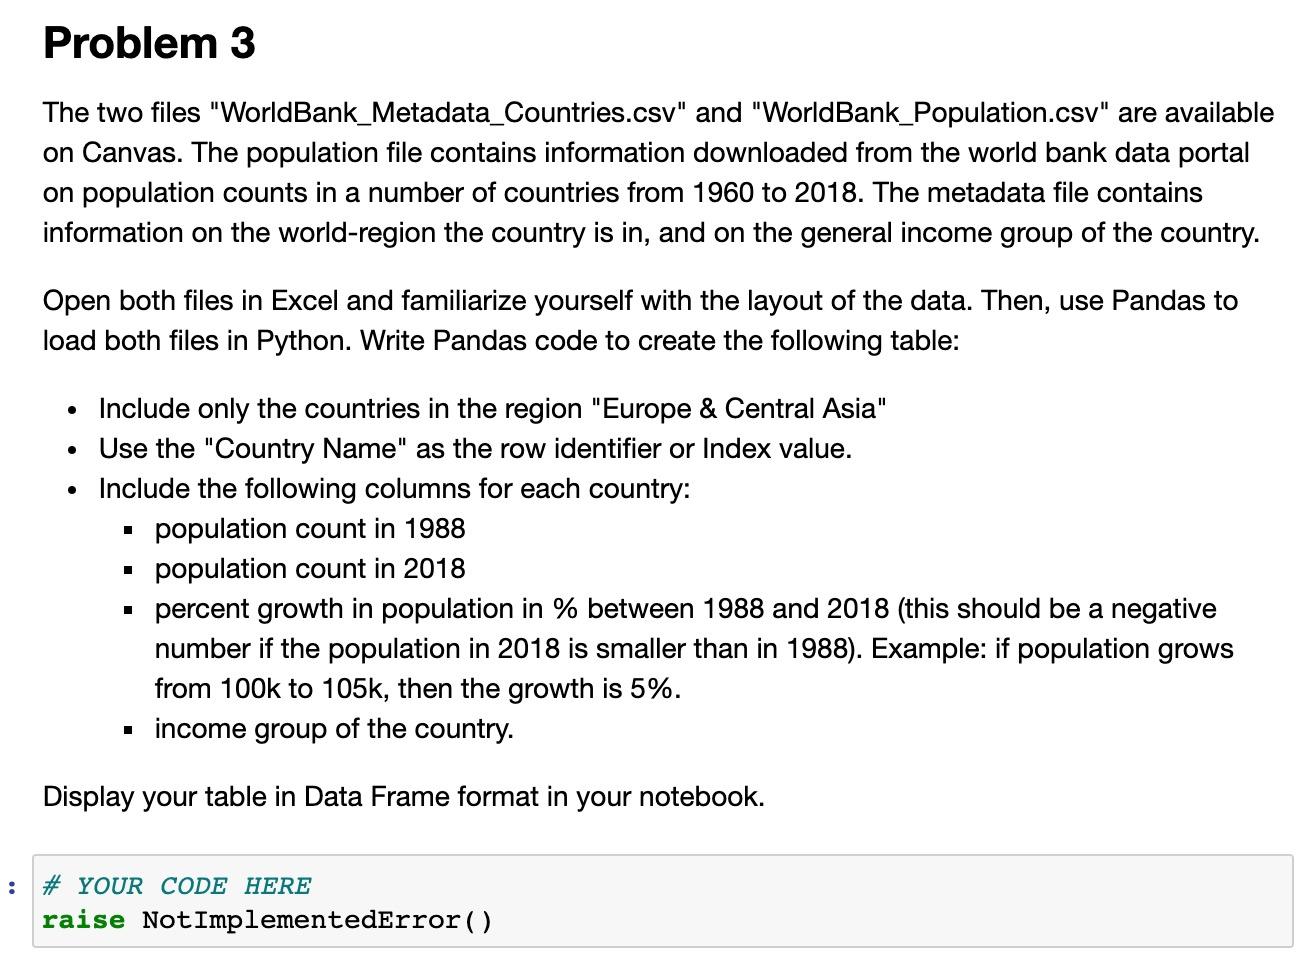
A B C D E F Country Code Region Income Group Special Notes TableName 2 ABW Latin Americ High income Aruba 3 AFG South Asia Low income Afghanistan 4 AGO Sub-Saharan Lower middle income Angola 5 ALB Europe & Cei Upper middle income Albania 6 AND Europe & Cei High income Andorra 7 ARB Arab World Arab World 8 ARE Middle East High income United Arab Emirates 9 ARG Latin Americ Upper middle income Argentina 10 ARM Europe & Cei Upper middle income Armenia 11 ASM East Asia & F Upper middle income American Samoa 12 ATG Latin Americ High income Antigua and Barbuda 13 AUS East Asia & F High income Fiscal year e Australia 14 AUT Europe & Cei High income A simple mu Austria 15 AZE Europe & Cei Upper middle income Azerbaijan 16 BDI Sub-Saharan Low income Burundi 17 BEL Europe & Cei High income A simple mu Belgium 18 BEN Sub-Saharan Low income Benin 19 BFA Sub-Saharan Low income Burkina Faso 20 BGD South Asia Lower middl Fiscal year e Bangladesh 21 BGR Europe & Cei Upper middle income Bulgaria 22 BHR Middle East High income Bahrain 23 BHS Latin Americ High income Bahamas, The 24 BIH Europe & Cei Upper middle income Bosnia and Herzegovina 25 BLR Europe & Cei Upper middl Data before Belarus 26 BLZ Latin Americ Upper middle income Belize 27 BMU North Ameri High income Bermuda 28 BOL Latin Americ Lower middle income Bolivia 29 BRA Latin Americ Upper middle income Brazil 30 BRB Latin Americ High income Barbados 31 BRN East Asia & F High income Brunei Darussalam 32 BTN South Asia Lower middle income Bhutan 33 BWA Sub-Saharan Upper middle income Botswana 34 CAF Sub-Saharan Low income Central African Republic 35 CAN North Ameri High income Fiscal year e Canada JAUN 2 Antigua and 13 Australia ettiin 7 Belgium 19 Burkina Faso 20 Bangladesh . Samo 23 Bahamas, T BHS 24 Bosnia and UNEUXUNDO EUSEBS 27 Bermuda BMU 28 BOMBOL an Barbara ARB 11 Brunei Darus DRN -4 bulan as Canada CAN Problem 3 The two files "WorldBank_Metadata_Countries.csv" and "WorldBank_Population.csv" are available on Canvas. The population file contains information downloaded from the world bank data portal on population counts in a number of countries from 1960 to 2018. The metadata file contains information on the world-region the country is in, and on the general income group of the country. Open both files in Excel and familiarize yourself with the layout of the data. Then, use Pandas to load both files in Python. Write Pandas code to create the following table: . Include only the countries in the region "Europe & Central Asia" Use the "Country Name" as the row identifier or Index value. Include the following columns for each country: population count in 1988 . population count in 2018 percent growth in population in % between 1988 and 2018 (this should be a negative number if the population in 2018 is smaller than in 1988). Example: if population grows from 100k to 105k, then the growth is 5%. income group of the country. Display your table in Data Frame format in your notebook. # YOUR CODE HERE raise Not ImplementedError()Step by Step Solution
There are 3 Steps involved in it
Step: 1

Get Instant Access to Expert-Tailored Solutions
See step-by-step solutions with expert insights and AI powered tools for academic success
Step: 2

Step: 3
Ace Your Homework with AI
Get the answers you need in no time with our AI-driven, step-by-step assistance
Get Started
Object Databases The Essentials
Authors: Mary E. S. Loomis
1st Edition
020156341X, 978-0201563412