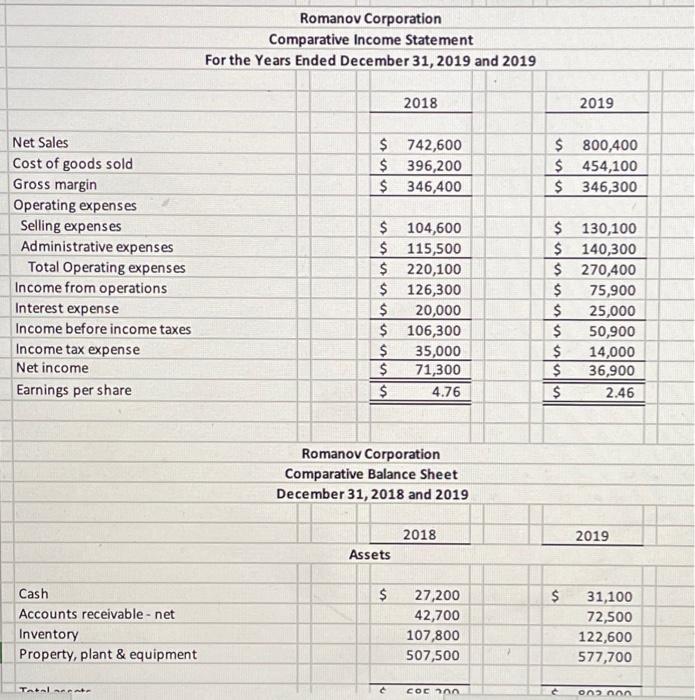
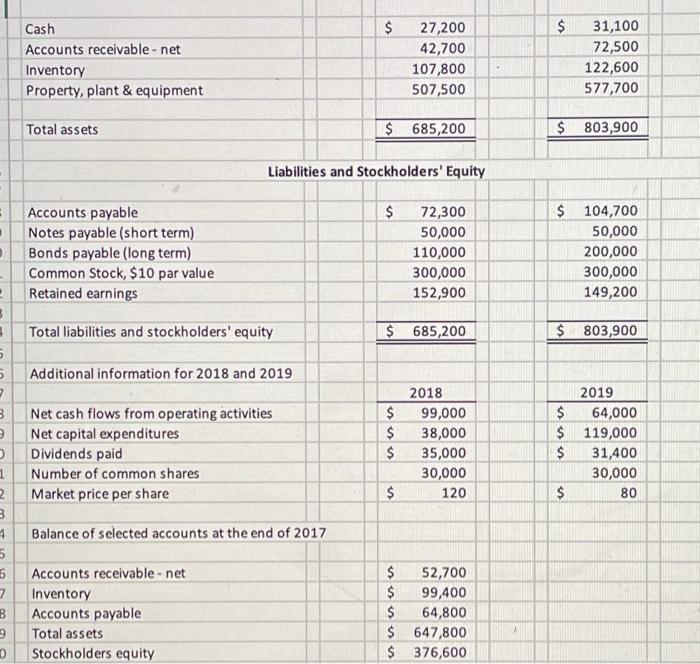
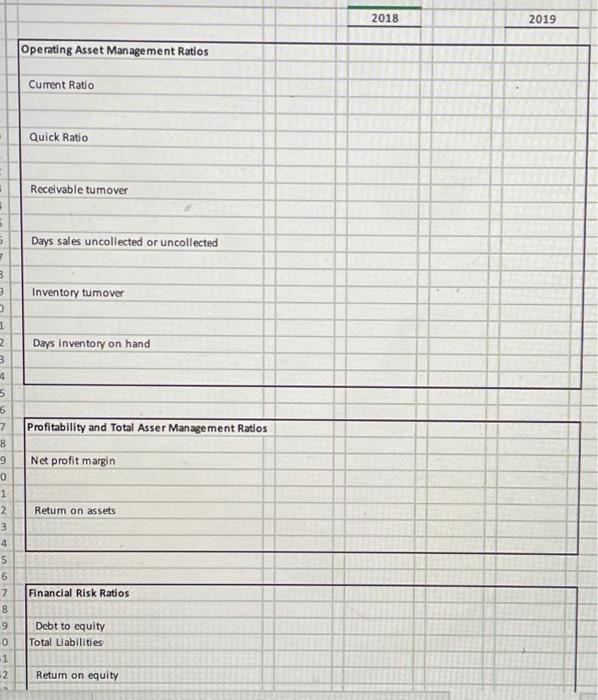
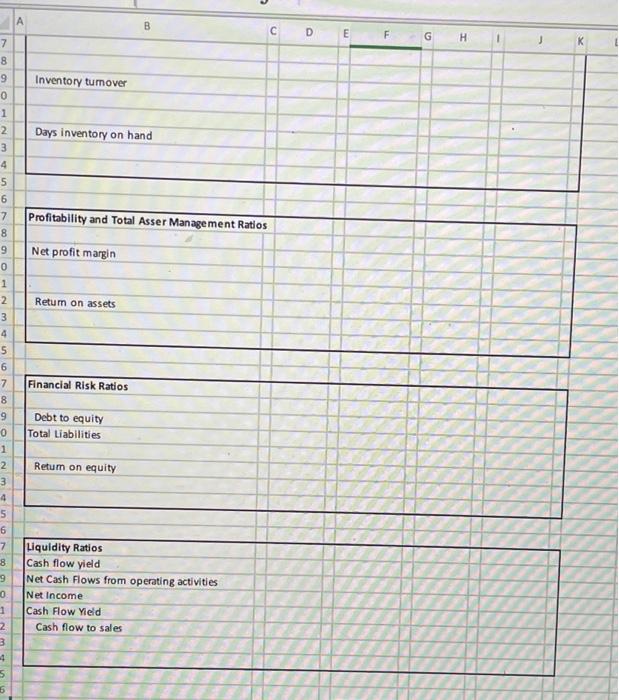
the first two i posted are just information you need to complete the last 2 i post . i was trying to fit it all in one but i couldn't thats why there is 4 pictures

Romanov Corporation Comparative Income Statement For the Years Ended December 31, 2019 and 2019 2018 2019 $ 742,600 $ 396,200 $ 346,400 $ 800,400 $ 454,100 $ 346,300 Net Sales Cost of goods sold Gross margin Operating expenses Selling expenses Administrative expenses Total Operating expenses Income from operations Interest expense Income before income taxes Income tax expense Net income Earnings per share $ 104,600 $ 115,500 $ 220,100 $ 126,300 $ 20,000 $ 106,300 $ 35,000 $ 71,300 $ 4.76 $ 130,100 $ 140,300 $ 270,400 $ 75,900 $ 25,000 $ 50,900 $ 14,000 $ 36,900 $ 2.46 Romanov Corporation Comparative Balance Sheet December 31, 2018 and 2019 2018 2019 Assets $ $ Cash Accounts receivable - net Inventory Property, plant & equipment 27,200 42,700 107,800 507,500 31,100 72,500 122,600 577,700 Totalmente c COC an Onon $ $ Cash Accounts receivable - net Inventory Property, plant & equipment 27,200 42,700 107,800 507,500 31,100 72,500 122,600 577,700 Total assets $ 685,200 $ 803,900 . . Liabilities and Stockholders' Equity $ Accounts payable Notes payable (short term) Bonds payable (long term) Common Stock, $10 par value Retained earnings 72,300 50,000 110,000 300,000 152,900 $ 104,700 50,000 200,000 300,000 149,200 Total liabilities and stockholders' equity $ 685,200 $ 803,900 3 . 5 5 7 3 Additional information for 2018 and 2019 Net cash flows from operating activities Net capital expenditures Dividends paid Number of common shares Market price per share $ $ $ 2018 99,000 38,000 35,000 30,000 120 2019 $ 64,000 $ 119,000 $ 31,400 30,000 $ $ 80 Balance of selected accounts at the end of 2017 1 2 3 4 5 5 7 B 9 0 Accounts receivable - net Inventory Accounts payable Total assets Stockholders equity $ 52,700 $ 99,400 $ 64,800 $ 647,800 $ 376,600 2018 2019 Operating Asset Management Ratios Current Ratio Quick Ratio Receivable tumover . 5 Days sales uncollected or uncollected 2 3 Inventory tumover Days inventory on hand Profitability and Total Asser Management Ratios 1 2 3 4 5 6 7 8 9 0 1 2 3 4 5 6 7 Net profit margin Return on assets Financial Risk Ratios 9 N 00 ONS Debt to equity Total Liabilities Return on equity B D E F G H 1 K 7 8 9 Inventory tumover Days inventory on hand Profitability and Total Asser Management Ratios 0 1 2 3 4 5 6 7 8 9 0 1 2 3 4 5 6 7 8 9 Net profit margin Return on assets Financial Risk Ratios Debt to equity Total Liabilities 0 Retum on equity 1 2 3 4 5 6 7 8 9 Liquidity Ratios Cash flow yield Net Cash Flows from operating activities Net Income Cash Flow Yield Cash flow to sales 0 1 2 3 4 5 6


