The first two questions refer to the following information:
A Canadian study measuring depression level in teens (as reported in theJournal of Adolescence, vol. 25, 2002) randomly sampled 112 male teens and 101 female teens, and scored them on a common depression scale (higher score representing more depression). The researchers suspected that the mean depression score for male teens is higher than for female teens, and wanted to check whether data would support this hypothesis.
1. If ?1and ?2represent the mean depression score for male teens and female teens respectively, which of the following is the appropriate pair of hypotheses in this case?
A:Ho:?1-?2=0Ha:?1-?2
B:H
o
:?
1
??
2
>0
H
a
:?
1
??
2
=0
C:H
o
:?
1
=?
2
H
a
:?
1
>?
2
D:H
o
:?
1
??
2
=0
H
a
:?
1
??
2
>0
Both (C) and (D) are correct.
2.
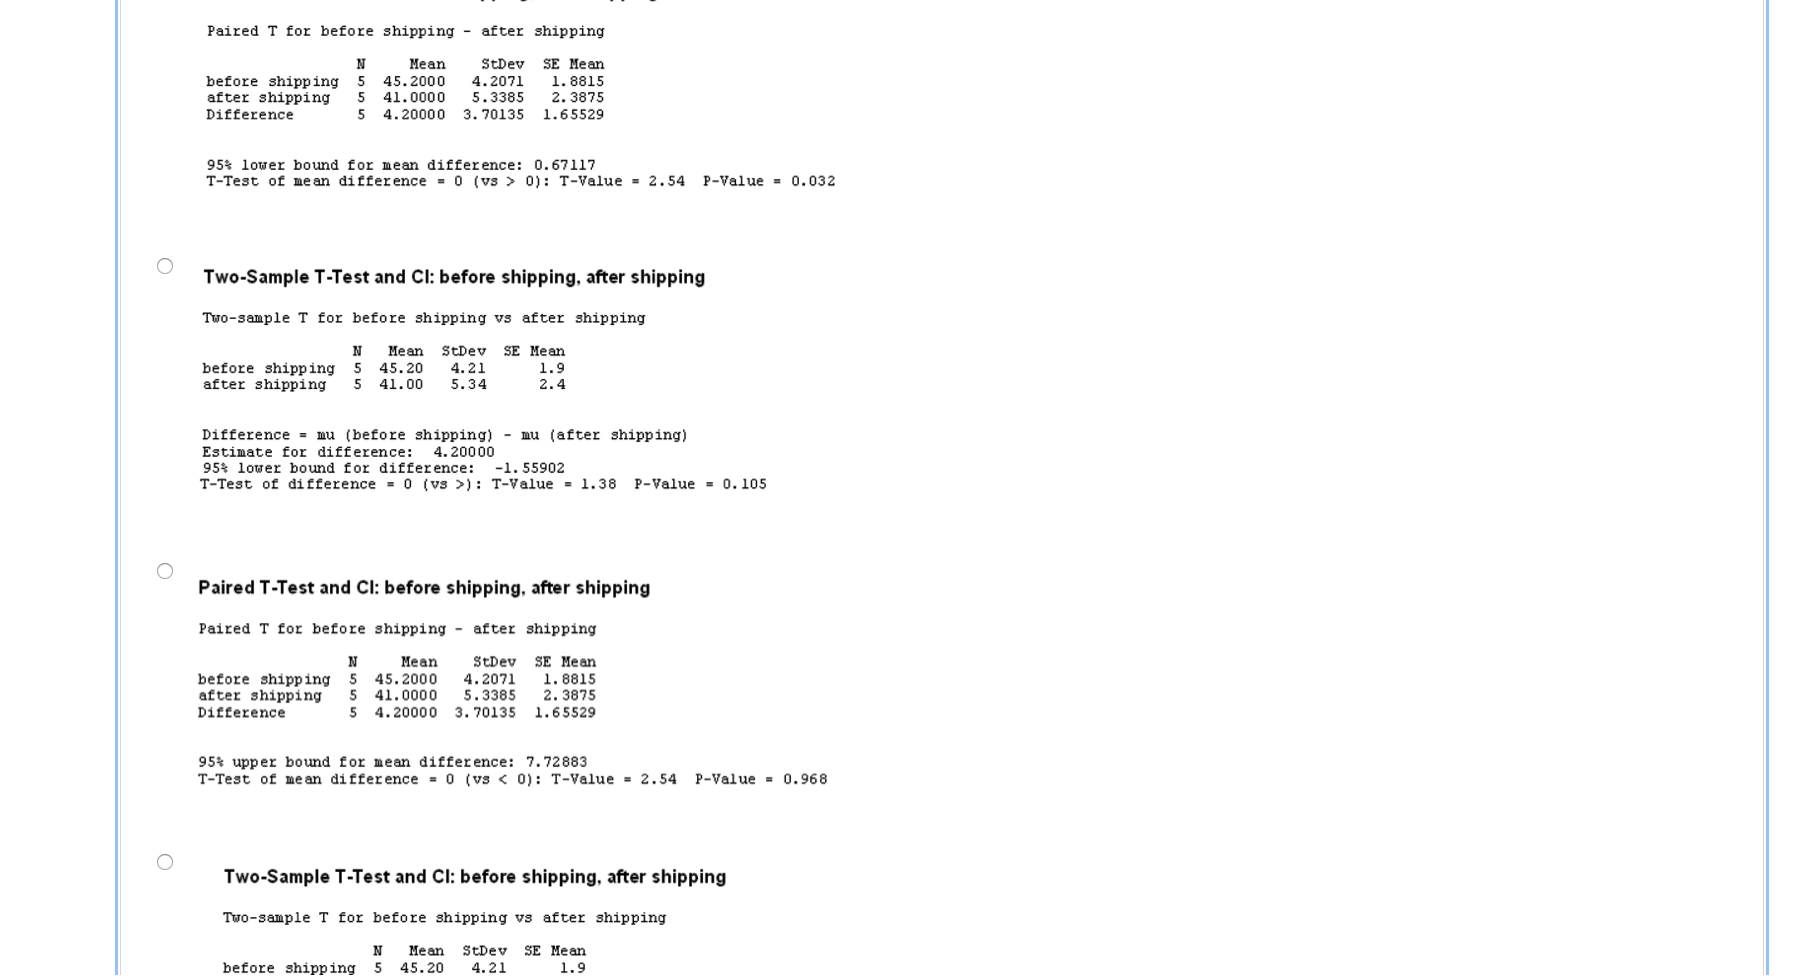
The following is the (edited) output for the test: Two-Sample T-Test and CI Sample N Mean StDev SE Mear 1 (M) 112 7. 38 6.95 0 . 66 2 (F 101 7. 15 6 .31 D. 63 Difference = mu (1) - mu (2) Estimate for difference: 0. 230 000 95% lower bound for difference: -1. 271079 T-Test of difference T-Value = 0.25 P-Value = 0. 400 DF = 210 From the output we learn that: the data provide sufficient evidence to reject Ho and to conclude that the mean depression score for male teens is larger than that of female teens. the data provide sufficient evidence to conclude that male and female teens do not differ in mean depression score. the data do not provide sufficient evidence to conclude that the mean depression score of male teens is larger than that of female teens. the data do not provide sufficient evidence to reject Ho, so we accept it, and conclude that male and female teens do not differ in mean depression score.Grain is fortified with vitamins at the factory when processed. But, before the product reaches the consumer, some of the vitamins may degrade due to time, heat during storage, etc. Suppose the vitamin contents (in milligrams per pound) of five bags of grain are measured at the factory before shipping, and then again at the retail store after shipping. The results are as shown: Vitamin content after shipping Bag Vitamin content before shipping 38 1 45 45 2 47 48 3 48 35 4 BE 39 5 48Paired T for before shipping - after shipping Mean StDev SE Mean before shipping 45. 2000 4. 2071 1. 8815 after shipping 41. 0000 5. 3385 2. 3875 Difference 4. 20000 3. 70135 1. 65529 95% lower bound for mean difference: 0. 67117 T-Test of mean difference = 0 (vs > 0): T-Value = 2.54 P-Value = 0.032 O Two-Sample T-Test and Cl: before shipping, after shipping Two-sample T for before shipping vs after shipping Mean StDev SE Mean before shipping 45.20 4.21 1.9 after shipping 41.00 5.34 2.4 Difference = mu (before shipping) - mu (after shipping) Estimate for difference: 4.20000 95% lower bound for difference: -1. 55902 T-Test of difference = 0 (vs >) : T-Value = 1.38 P-Value = 0. 105 O Paired T-Test and Cl: before shipping, after shipping Paired T for before shipping - after shipping Mean StDev SE Mean before shipping 45. 2000 4. 2071 1. 8815 after shipping 41. 0000 5. 3385 2. 3875 Difference 4. 20000 3. 70135 1. 65529 95% upper bound for mean difference: 7. 72883 T-Test of mean difference = 0 (vs


