Question
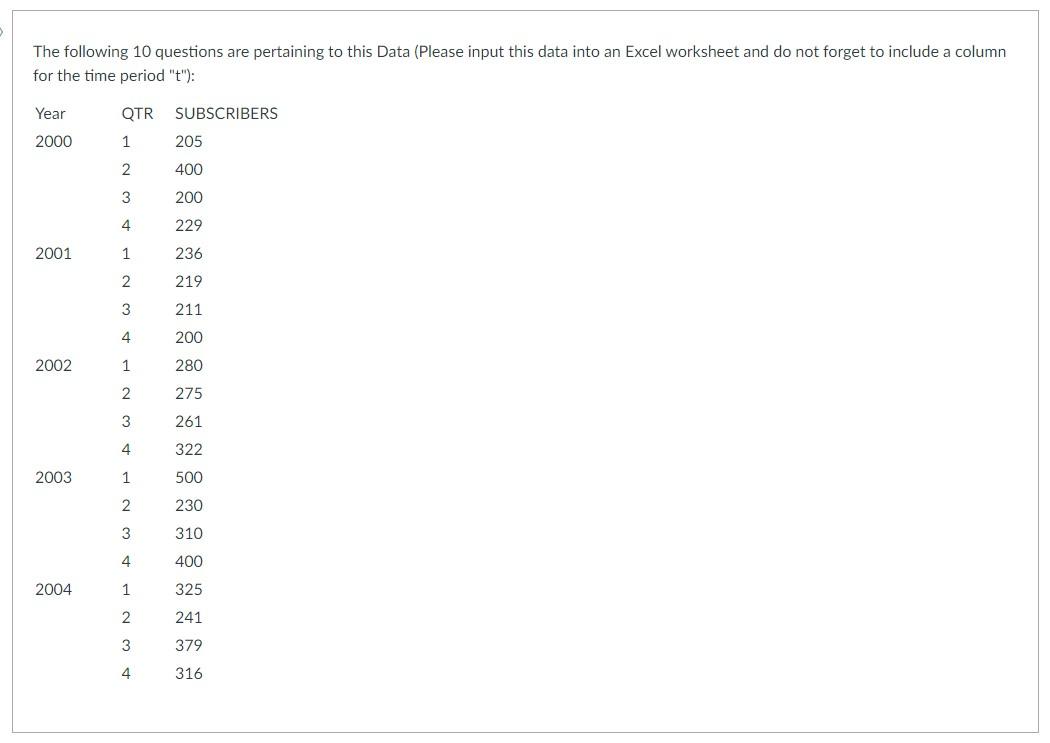
The following 10 questions are pertaining to this Data (Please input this data into an Excel worksheet and do not forget to include a


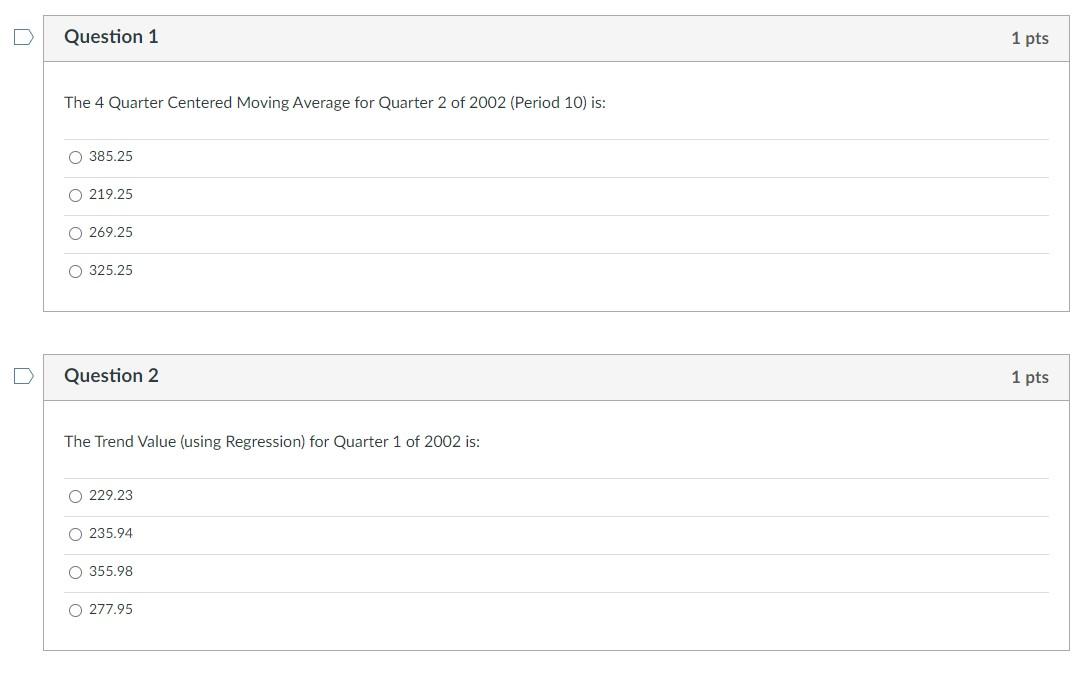
The following 10 questions are pertaining to this Data (Please input this data into an Excel worksheet and do not forget to include a column for the time period "t"): Year QTR SUBSCRIBERS 2000 1 205 2 400 3 200 229 2001 1 236 219 3 211 4 200 2002 1 280 275 3 261 322 2003 1 500 2 230 3 310 4 400 2004 1 325 2 241 3 379 4 316 Question 1 1 pts The 4 Quarter Centered Moving Average for Quarter 2 of 2002 (Period 10) is: O 385.25 O 219.25 O 269.25 O 325.25 Question 2 1 pts The Trend Value (using Regression) for Quarter 1 of 2002 is: O 229.23 O 235.94 O 355.98 O 277.95
Step by Step Solution
3.44 Rating (151 Votes )
There are 3 Steps involved in it
Step: 1
1 four qtr centered quarter sales moving avg moving avg 1 205 2 400 3 200 2585 262375 4 229 26625 24...
Get Instant Access to Expert-Tailored Solutions
See step-by-step solutions with expert insights and AI powered tools for academic success
Step: 2

Step: 3

Ace Your Homework with AI
Get the answers you need in no time with our AI-driven, step-by-step assistance
Get StartedRecommended Textbook for
Statistics Data Analysis And Decision Modeling
Authors: James R. Evans
5th Edition
132744287, 978-0132744287
Students also viewed these Accounting questions
Question
Answered: 1 week ago
Question
Answered: 1 week ago
Question
Answered: 1 week ago
Question
Answered: 1 week ago
Question
Answered: 1 week ago
Question
Answered: 1 week ago
Question
Answered: 1 week ago
Question
Answered: 1 week ago
Question
Answered: 1 week ago
Question
Answered: 1 week ago
Question
Answered: 1 week ago
Question
Answered: 1 week ago
Question
Answered: 1 week ago
Question
Answered: 1 week ago
Question
Answered: 1 week ago
Question
Answered: 1 week ago
Question
Answered: 1 week ago
Question
Answered: 1 week ago
Question
Answered: 1 week ago
Question
Answered: 1 week ago
Question
Answered: 1 week ago
View Answer in SolutionInn App


