

Question
The following case is about Netflix, Inc. and its accounting for streaming content. When beginning its streaming service in 2007, Netflix offered only licensed content.
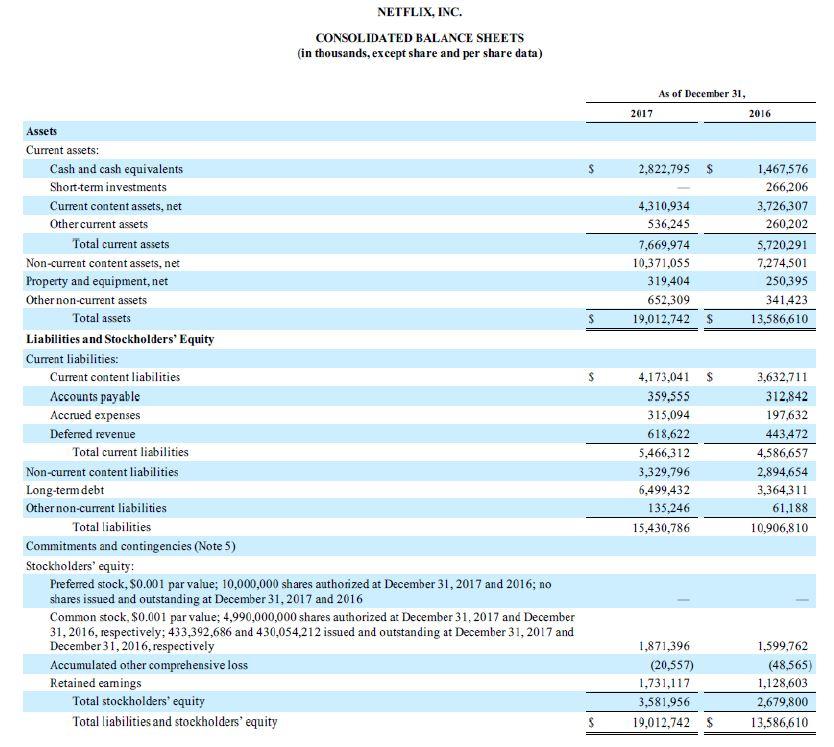
The following case is about Netflix, Inc. and its accounting for streaming content. When beginning its streaming service in 2007, Netflix offered only licensed content. This relates to shows produced by other studios and originally aired on TV (e.g., How to Get Away with Murder) or Netflix Originals produced by other studios (e.g., House of Cards). The company pays these studios a license fee, which is capitalized on the balance sheet as content asset and amortized over its useful life (usually four years).
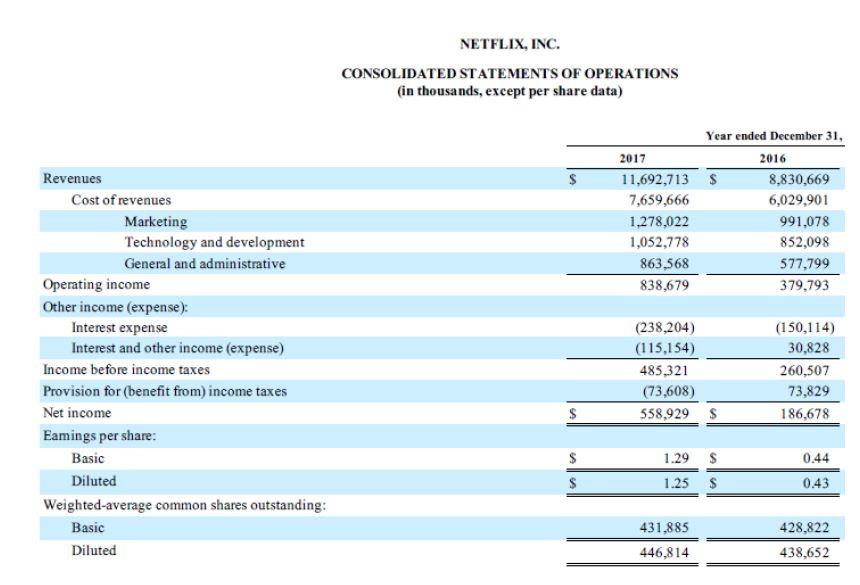
As Netflix grew over the years, it recognized that such licensed content entails higher costs as compared to selfproduced content, which would eliminate any middlemen and retain intellectual ownership. The company thus began to increase its focus on selfproduced series (e.g., Stranger Things). The downside of this strategic shift is that selfproduced series are capital intensive in that there is a large cash outflow during the production phase, but no corresponding income or growth in subscriptions. In its financial statements, Netflix recognizes the content asset, as a show is produced. Amortization begins once the show becomes available and is based on a longer useful life (compared to licensed content). In any case, Netflix revenue is based on subscriptions, i.e. the monthly fee that viewers pay to use the service.
a. Relate Netflix shift to selfproduced content to strategy analysis: (i) How does understanding a companys strategy help in financial statement analysis? (ii) Refer to one specific item in Netflix financial statements and explain how this item will change as a result of the companys revised strategy.
b. Some analysts have criticized that the companys free cash flow generation is worsening. Following a negative free cash flow (to debt and equity) of $2bn in 2017, Netflix expects the metric to be a negative $34bn in 2018. (i) Do you agree that Netflix is only burning cash or do you think that for a company in a growth stage, such as Netflix, other metrics besides free cash flows might be more important? If so, which? (ii) As a counter argument to such criticism, Netflix calculates a ratio of cash spending on content to P&L spending on content, where the numerator is its annual cash spending on content assets and the denominator is the amortization charge recorded in the P&L. This ratio is currently 1.42. Briefly explain the rationale of this ratio, and how you expect it to change following the changed strategy.
c. The largest part of Netflix cost of revenues relates to its amortization of content assets, which in 2017 was about $6.3bn. In line with the companys revised strategy, assume that Netflix had invested a higher amount in longerlived selfproduced content assets. Assume this would have reduced the amortization charge by $0.8bn. (i) Calculate the companys gross profit margin for 2017 as reported and as adjusted based on these revised assumptions. (3 points) (ii) What do you expect to happen with Netflix profitability, as the company moves to More selfproduced content? What else does the successful implementation of this strategy depend on?
d. To finance its shift in strategy, Netflix predominantly relies on increasing its leverage by issuing longterm debt. It argues that financing growth through the debt market is currently more efficient than issuing equity. Briefly describe two benefits of debt as compared to equity that makes it more efficient. Also, what is the impact of a potentially larger asset base as a result of Netflix focus on selfproduced content?
Step by Step Solution
There are 3 Steps involved in it
Step: 1

Get Instant Access to Expert-Tailored Solutions
See step-by-step solutions with expert insights and AI powered tools for academic success
Step: 2

Step: 3
Ace Your Homework with AI
Get the answers you need in no time with our AI-driven, step-by-step assistance
Get Started
Entrepreneurial Finance
Authors: Gary E. Gibbons, Robert D. Hisrich, Carlos Marques DaSilva
1st Edition
1452274177, 978-1452274171