

Answered step by step
Verified Expert Solution
Question
1 Approved Answer
The following data apply to Problems 4 through 10: A pension fund manager is considering three mutual funds. The first is a stock fund. the
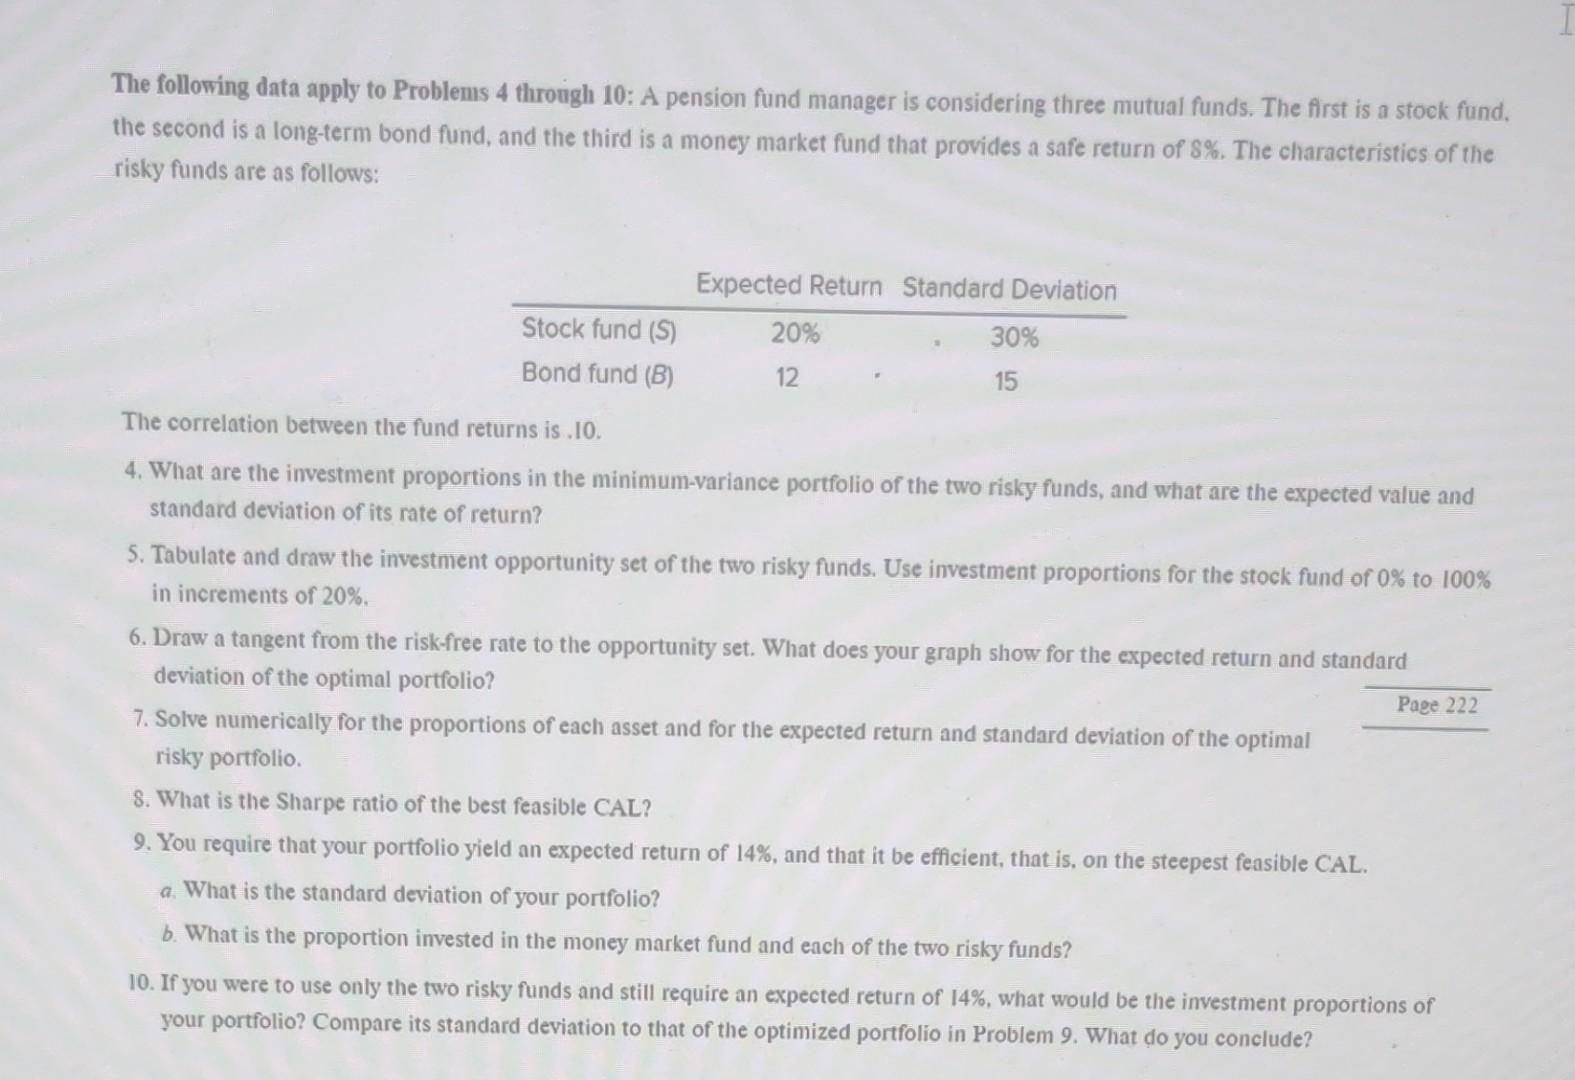
The following data apply to Problems 4 through 10: A pension fund manager is considering three mutual funds. The first is a stock fund. the second is a long-term bond fund, and the third is a money market fund that provides a safe return of 8%. The characteristics of the risky funds are as follows: The correlation between the fund returns is .10. 4. What are the investment proportions in the minimum-variance portfolio of the two risky funds, and what are the expected value and standard deviation of its rate of return? 5. Tabulate and draw the investment opportunity set of the two risky funds. Use investment proportions for the stock fund of 0% to 100% in increments of 20%. 6. Draw a tangent from the risk-free rate to the opportunity set. What does your graph show for the expected return and standard deviation of the optimal portfolio? 7. Solve numerically for the proportions of each asset and for the expected return and standard deviation of the optimal risky portfolio. 8. What is the Sharpe ratio of the best feasible CAL? 9. You require that your portfolio yield an expected return of 14%, and that it be efficient, that is, on the steepest feasible CAL. a. What is the standard deviation of your portfolio? b. What is the proportion invested in the money market fund and each of the two risky funds? 10. If you were to use only the two risky funds and still require an expected return of 14%, what would be the investment proportions of your portfolio? Compare its standard deviation to that of the optimized portfolio in Problem 9 . What do you conclude? The following data apply to Problems 4 through 10: A pension fund manager is considering three mutual funds. The first is a stock fund. the second is a long-term bond fund, and the third is a money market fund that provides a safe return of 8%. The characteristics of the risky funds are as follows: The correlation between the fund returns is .10. 4. What are the investment proportions in the minimum-variance portfolio of the two risky funds, and what are the expected value and standard deviation of its rate of return? 5. Tabulate and draw the investment opportunity set of the two risky funds. Use investment proportions for the stock fund of 0% to 100% in increments of 20%. 6. Draw a tangent from the risk-free rate to the opportunity set. What does your graph show for the expected return and standard deviation of the optimal portfolio? 7. Solve numerically for the proportions of each asset and for the expected return and standard deviation of the optimal risky portfolio. 8. What is the Sharpe ratio of the best feasible CAL? 9. You require that your portfolio yield an expected return of 14%, and that it be efficient, that is, on the steepest feasible CAL. a. What is the standard deviation of your portfolio? b. What is the proportion invested in the money market fund and each of the two risky funds? 10. If you were to use only the two risky funds and still require an expected return of 14%, what would be the investment proportions of your portfolio? Compare its standard deviation to that of the optimized portfolio in Problem 9 . What do you conclude
Step by Step Solution
There are 3 Steps involved in it
Step: 1

Get Instant Access to Expert-Tailored Solutions
See step-by-step solutions with expert insights and AI powered tools for academic success
Step: 2

Step: 3
Ace Your Homework with AI
Get the answers you need in no time with our AI-driven, step-by-step assistance
Get Started
Forex Analysis And Strategies For Day Traders Profitable Investing With Currency Swaps Hedges And Scalps For Both Beginning And Advanced Traders
Authors: Steve Alkandros
1st Edition
1545117039, 978-1545117033