

Answered step by step
Verified Expert Solution
Question
1 Approved Answer
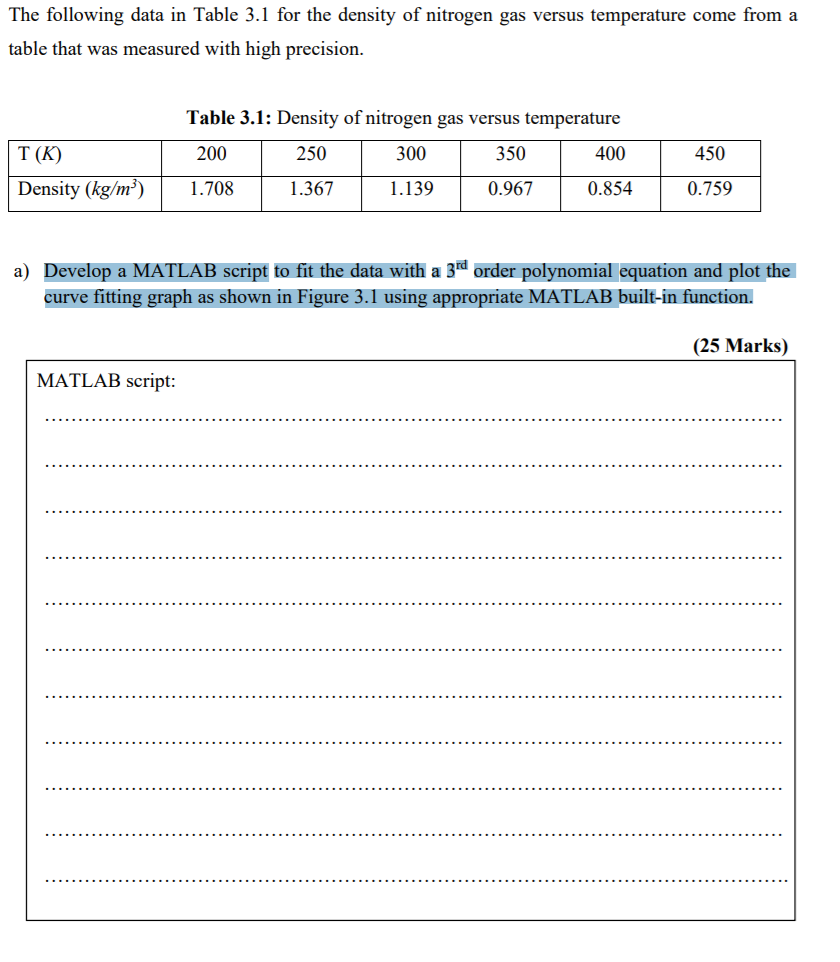
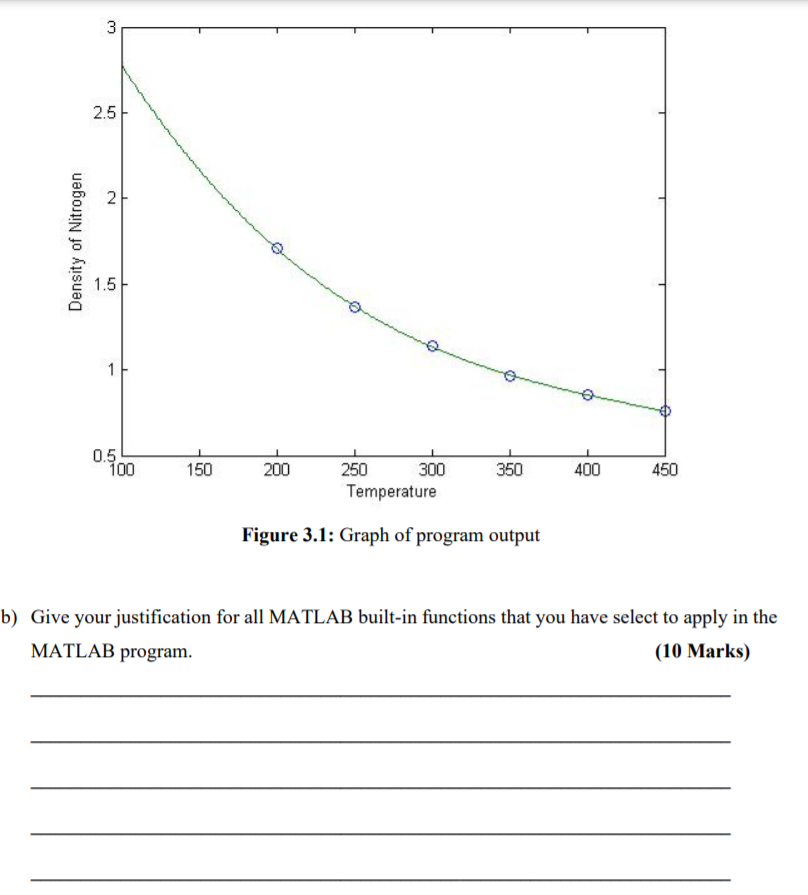
The following data in Table 3.1 for the density of nitrogen gas versus temperature come from a table that was measured with high precision. Table
Step by Step Solution
There are 3 Steps involved in it
Step: 1

Get Instant Access to Expert-Tailored Solutions
See step-by-step solutions with expert insights and AI powered tools for academic success
Step: 2

Step: 3
Ace Your Homework with AI
Get the answers you need in no time with our AI-driven, step-by-step assistance
Get Started
Scientific And Statistical Database Management 21st International Conference Ssdbm 2009 New Orleans La Usa June 2009 Proceedings Lncs 5566
Authors: Marianne Winslett
2009th Edition
3642022782, 978-3642022784