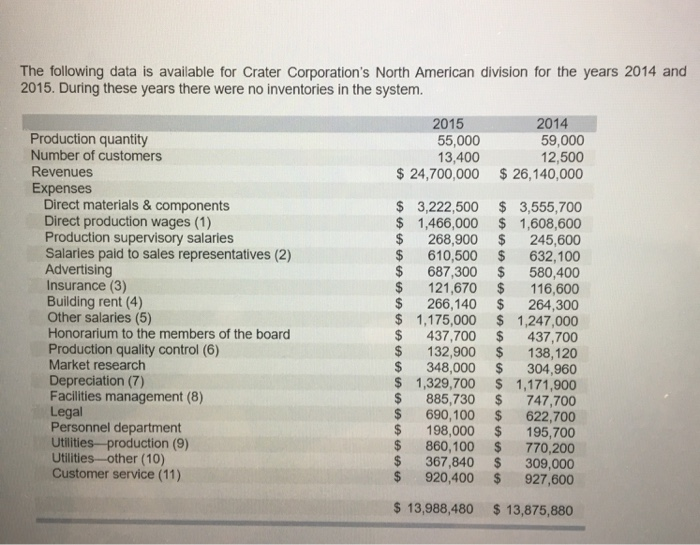
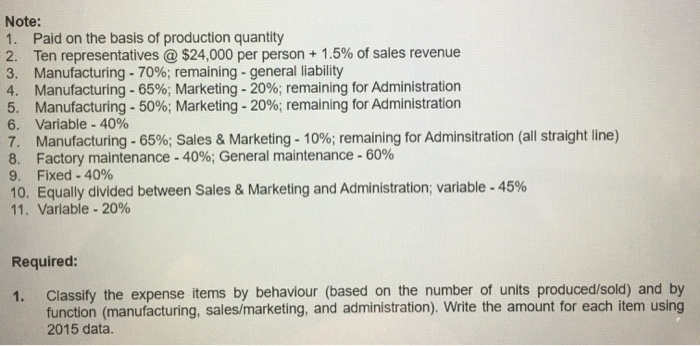
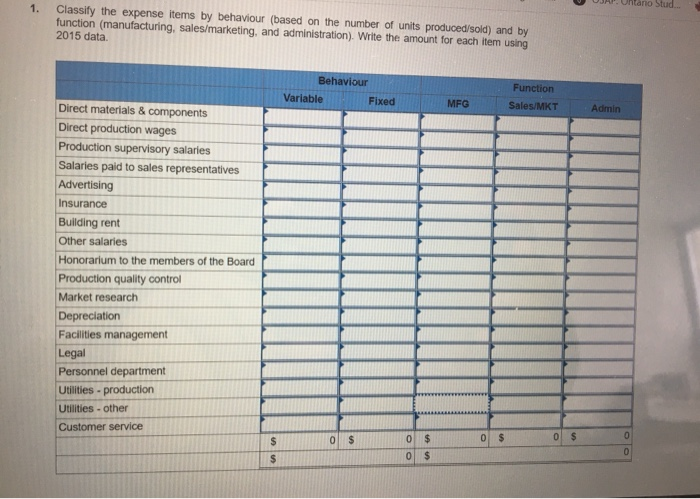
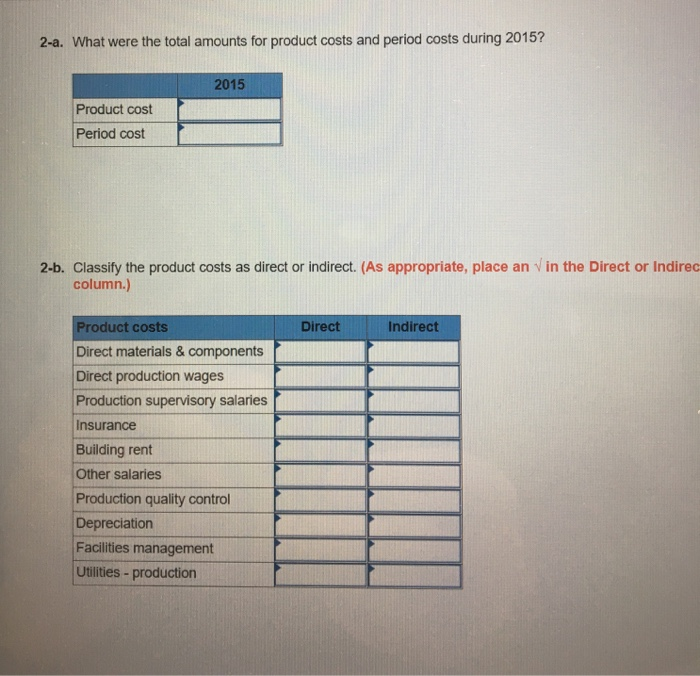
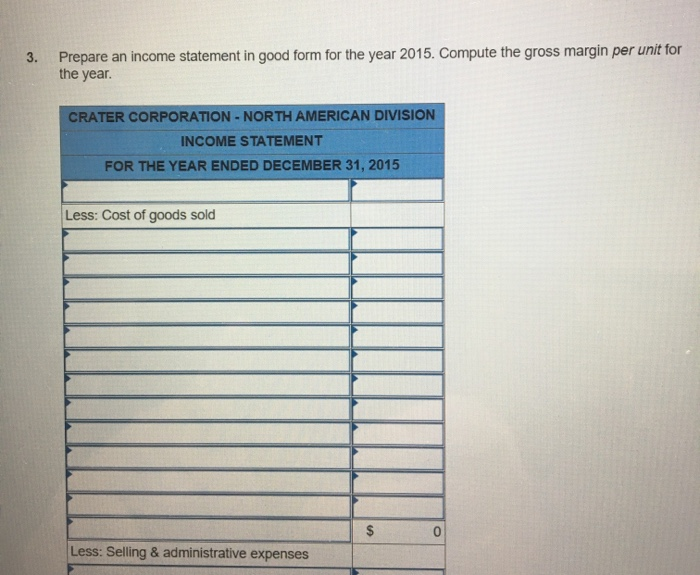
The following data is available for Crater Corporation's North American division for the years 2014 and 2015. During these years there were no inventories in the system. 2015 55,000 13,400 $ 24,700,000 2014 59.000 12,500 $ 26,140,000 Production quantity Number of customers Revenues Expenses Direct materials & components Direct production wages (1) Production supervisory salaries Salaries paid to sales representatives (2) Advertising Insurance (3) Building rent (4) Other salaries (5) Honorarium to the members of the board Production quality control (6) Market research Depreciation (7) Facilities management (8) Legal Personnel department Utilities production (9) Utilities other (10) Customer service (11) $ $ $ $ $ $ $ $ $ $ $ $ 3,222,500 1,466,000 268,900 610,500 687,300 121,670 266,140 1,175,000 437,700 132,900 348,000 1,329,700 885,730 690,100 198,000 860,100 367,840 920,400 $ 3,555,700 $ 1,608,600 $ 245,600 $ 632,100 $ 580,400 $ 116,600 $ 264,300 $ 1,247,000 $ 437,700 $ 138,120 $ 304,960 $ 1,171,900 $ 747,700 $ 622,700 $ 195,700 $ 770,200 $ 309,000 $ 927,600 $ $ $ $ $ $ 13,988,480 $ 13,875,880 Note: 1. Paid on the basis of production quantity 2. Ten representatives @ $24,000 per person + 1.5% of sales revenue 3. Manufacturing - 70%; remaining - general liability 4. Manufacturing - 65%; Marketing - 20%; remaining for Administration 5. Manufacturing - 50%; Marketing - 20%; remaining for Administration 6. Variable - 40% 7. Manufacturing - 65%; Sales & Marketing - 10%; remaining for Adminsitration (all straight line) 8. Factory maintenance - 40%; General maintenance -60% 9. Fixed - 40% 10. Equally divided between Sales & Marketing and Administration; variable -45% 11. Variable - 20% Required: Classify the expense items by behaviour (based on the number of units produced/sold) and by function (manufacturing, sales/marketing, and administration). Write the amount for each item using 2015 data. A Untano Stud... 1. Classify the expense items by behaviour (based on the number of units produced/sold) and by function manufacturing, sales/marketing, and administration). Write the amount for each item using 2015 data. Behaviour Variable Fixed MFG Function Sales/MKT Admin Direct materials & components Direct production wages Production supervisory salaries Salaries paid to sales representatives Advertising Insurance Building rent Other salaries Honorarium to the members of the Board Production quality control Market research Depreciation Facilities management Legal Personnel department Utilities - production Utilities - other Customer service 0 $ 2-a. What were the total amounts for product costs and period costs during 2015? 2015 Product cost Period cost 2-b. Classify the product costs as direct or indirect. (As appropriate, place an V in the Direct or Indirec column.) Direct Indirect Product costs Direct materials & components Direct production wages Production supervisory salaries Insurance Building rent Other salaries Production quality control Depreciation Facilities management Utilities - production 2-a. What were the total amounts for product costs and period costs during 2015? 2015 Product cost Period cost 2-b. Classify the product costs as direct or indirect. (As appropriate, place an V in the Direct or Indirec column.) Direct Indirect Product costs Direct materials & components Direct production wages Production supervisory salaries Insurance Building rent Other salaries Production quality control Depreciation Facilities management Utilities - production 3. Prepare an income statement in good form for the year 2015. Compute the gross margin per unit for the year. CRATER CORPORATION - NORTH AMERICAN DIVISION INCOME STATEMENT FOR THE YEAR ENDED DECEMBER 31, 2015 Less: Cost of goods sold $ Less: Selling & administrative expenses Less: Selling & administrative expenses 0