Answered step by step
Verified Expert Solution
Link Copied!

Question

1 Approved Answer

The following data sets are annual growth rates for two products Calculate Statistics with Excel Y 2013 2014 2015 2016 2017 2018 2019 2020 5.35%
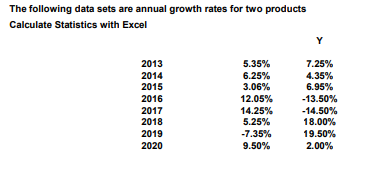
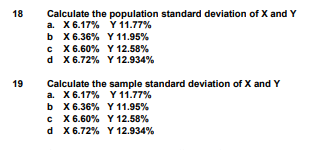
image text in transcribedimage text in transcribed

The following data sets are annual growth rates for two products Calculate Statistics with Excel Y 2013 2014 2015 2016 2017 2018 2019 2020 5.35% 6.25% 3.06% 12.05% 14.25% 5.25% -7.35% 9.50% 7.25% 4.35% 6.95% -13.50% -14.50% 18.00% 19.50% 2.00% 18 Calculate the population standard deviation of X and Y a. X 6.17% Y 11.77% b X 6.36% Y 11.95% C X 6.60% Y 12.58% d x 6.72% Y 12.934% 19 Calculate the sample standard deviation of X and Y a. X 6.17% Y 11.77% b X 6.36% Y 11.95% c X 6.60% Y 12.58% d x 6.72% Y 12.934%

Step by Step Solution

There are 3 Steps involved in it

Step: 1

blur-text-image

Get Instant Access to Expert-Tailored Solutions

See step-by-step solutions with expert insights and AI powered tools for academic success

Step: 2

blur-text-image_2

Step: 3

blur-text-image_3

Ace Your Homework with AI

Get the answers you need in no time with our AI-driven, step-by-step assistance

Get Started

Recommended Textbook for

Financial management theory and practice

Authors: Eugene F. Brigham and Michael C. Ehrhardt

12th Edition

978-0030243998, 30243998, 324422695, 978-0324422696

More Books

Students also viewed these Finance questions