

Answered step by step
Verified Expert Solution
Question
1 Approved Answer
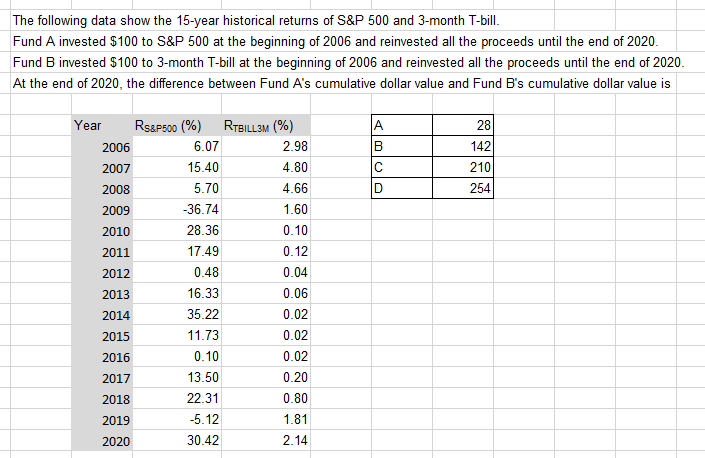
The following data show the 15-year historical returns of S&P 500 and 3-month T-bill. Fund A invested $100 to S&P 500 at the beginning of
Step by Step Solution
There are 3 Steps involved in it
Step: 1

Get Instant Access to Expert-Tailored Solutions
See step-by-step solutions with expert insights and AI powered tools for academic success
Step: 2

Step: 3
Ace Your Homework with AI
Get the answers you need in no time with our AI-driven, step-by-step assistance
Get Started
Methods And Finance
Authors: Emiliano Ippoliti, Ping Chen
1st Edition
3319498711, 978-3319498713