Answered step by step
Verified Expert Solution
Question
1 Approved Answer
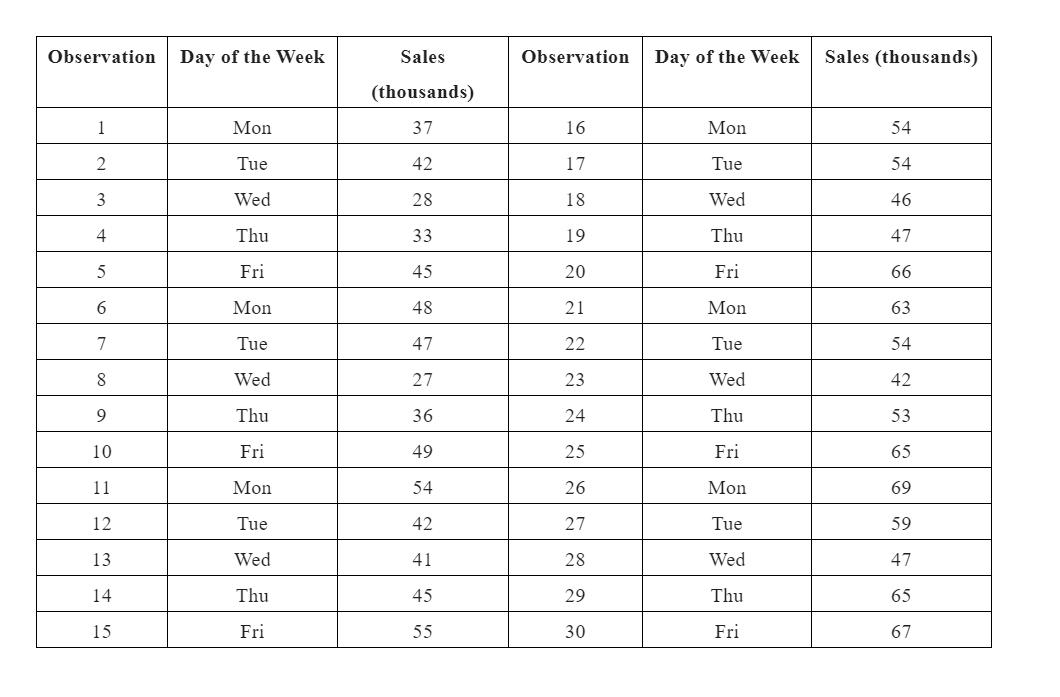
The following data was taken from a Builders Supply Wholesaler that is open only 5 days a week. If you graph the data you can


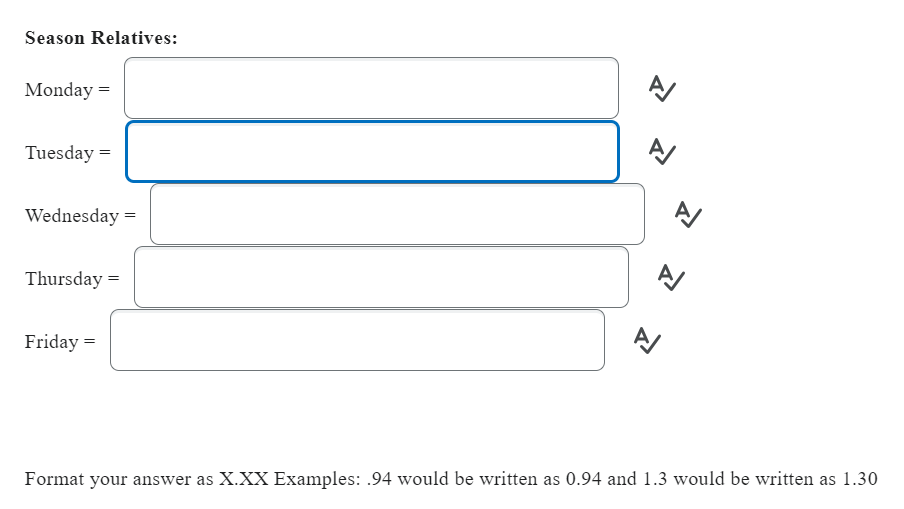
 The following data was taken from a Builders Supply Wholesaler that is open only 5 days a week. If you graph the data you can see the data does exhibit an uphill trend. Using the Centered Moving Average Technique described in the textbook, compute season relatives for each day of the week. Season Relatives: Monday = Tuesday = ( Wednesday Thursday = Friday = A A A A A Format your answer as X.XX Examples: .94 would be written as 0.94 and 1.3 would be written as 1.30
 Step by Step Solution
There are 3 Steps involved in it
Step: 1

Get Instant Access to Expert-Tailored Solutions
See step-by-step solutions with expert insights and AI powered tools for academic success
Step: 2

Step: 3

Ace Your Homework with AI
Get the answers you need in no time with our AI-driven, step-by-step assistance
Get Started


