

Answered step by step
Verified Expert Solution
Question
1 Approved Answer
The following diagram shows the investment opportunity set for portfolios containing stocks A and B, with Point A on the graph representing a portfolio with
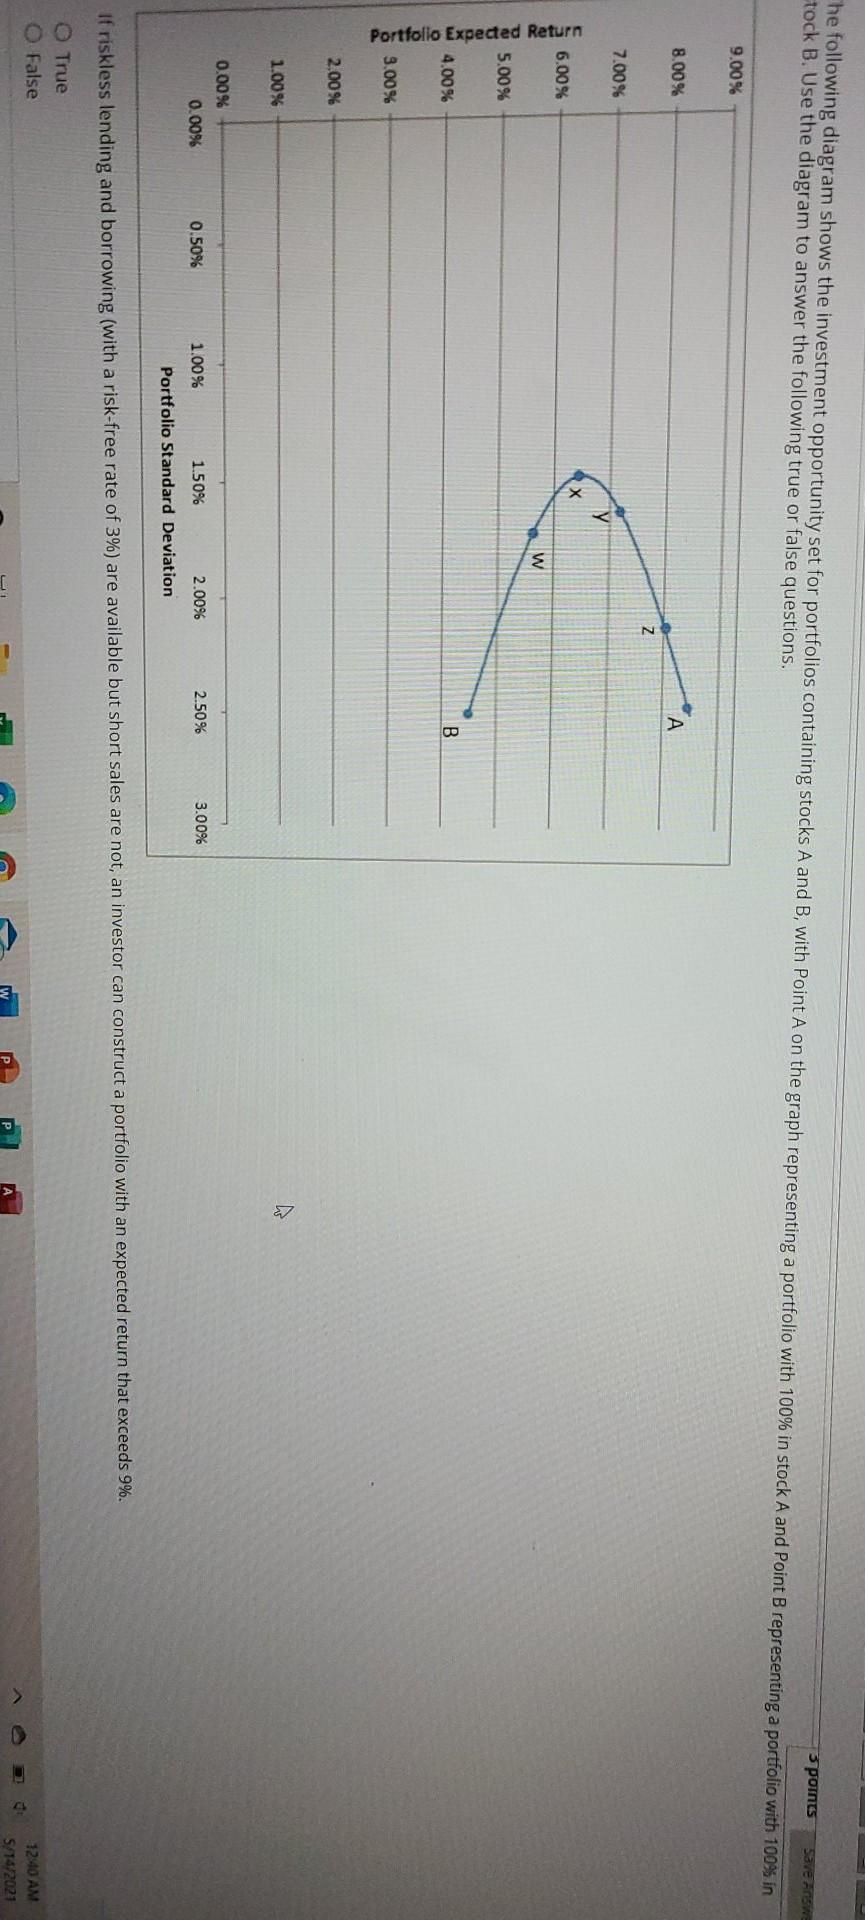
The following diagram shows the investment opportunity set for portfolios containing stocks A and B, with Point A on the graph representing a portfolio with 100% in stock A and Point B representing a portfolio with 100% in tock B. Use the diagram to answer the following true or false questions, 5 points Save 9.00% 8.00% z 7.00% 6.00% w 5.00% Portfolio Expected Return 4.00% B 3.00% 2.00% 1.00% 0.00% 0.00% 0.50% 1.00% 1.50% 2.00% 2.50% 3.00% Portfolio Standard Deviation If riskless lending and borrowing (with a risk-free rate of 3%) are available but short sales are not, an investor can construct a portfolio with an expected return that exceeds 9%. True O False A 12:40 AM 5/14/2021
Step by Step Solution
There are 3 Steps involved in it
Step: 1

Get Instant Access to Expert-Tailored Solutions
See step-by-step solutions with expert insights and AI powered tools for academic success
Step: 2

Step: 3
Ace Your Homework with AI
Get the answers you need in no time with our AI-driven, step-by-step assistance
Get Started
Investing In Justice An Introduction To Legal Finance Lawsuit Advances And Litigation Funding
Authors: Max Volsky
1st Edition
0988510502, 978-0988510500