

Answered step by step
Verified Expert Solution
Question
1 Approved Answer
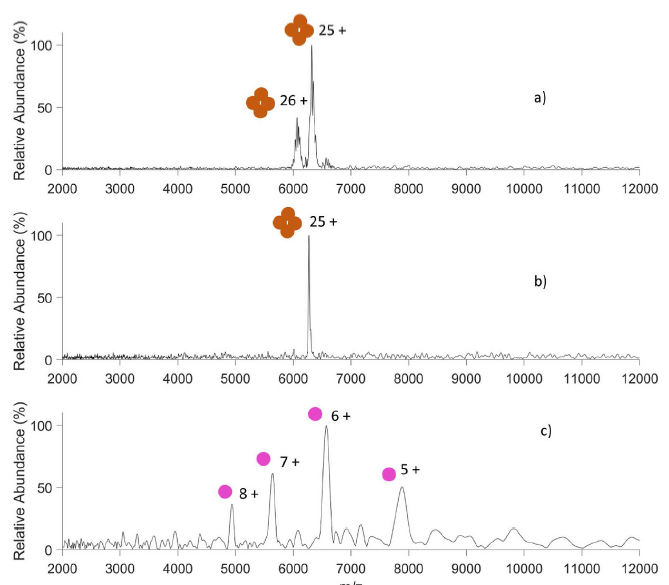
The following figure shows a ) MS 1 spectrum of aldolase, 5 0 ms transient. b ) Mirror - switching isolation of the tetramer 2
The following figure shows a MS spectrum of aldolase, ms transient. b Mirrorswitching isolation of the tetramer charge state, ms transient. c eV SID spectrum, ms transient.
Using the mass spectrum of b estimate the molar mass of aldolase.
Using the peaks of and on the mass spectrum of c estimate the mz values of the singly charge fragment ion.
Using the peak of on the mass spectrum of c estimate the resolving power of the mass spectrometer.
Step by Step Solution
There are 3 Steps involved in it
Step: 1

Get Instant Access to Expert-Tailored Solutions
See step-by-step solutions with expert insights and AI powered tools for academic success
Step: 2

Step: 3
Ace Your Homework with AI
Get the answers you need in no time with our AI-driven, step-by-step assistance
Get Started
Investing All In One
Authors: Eric Tyson
1st Edition
1119376629, 978-1119376620