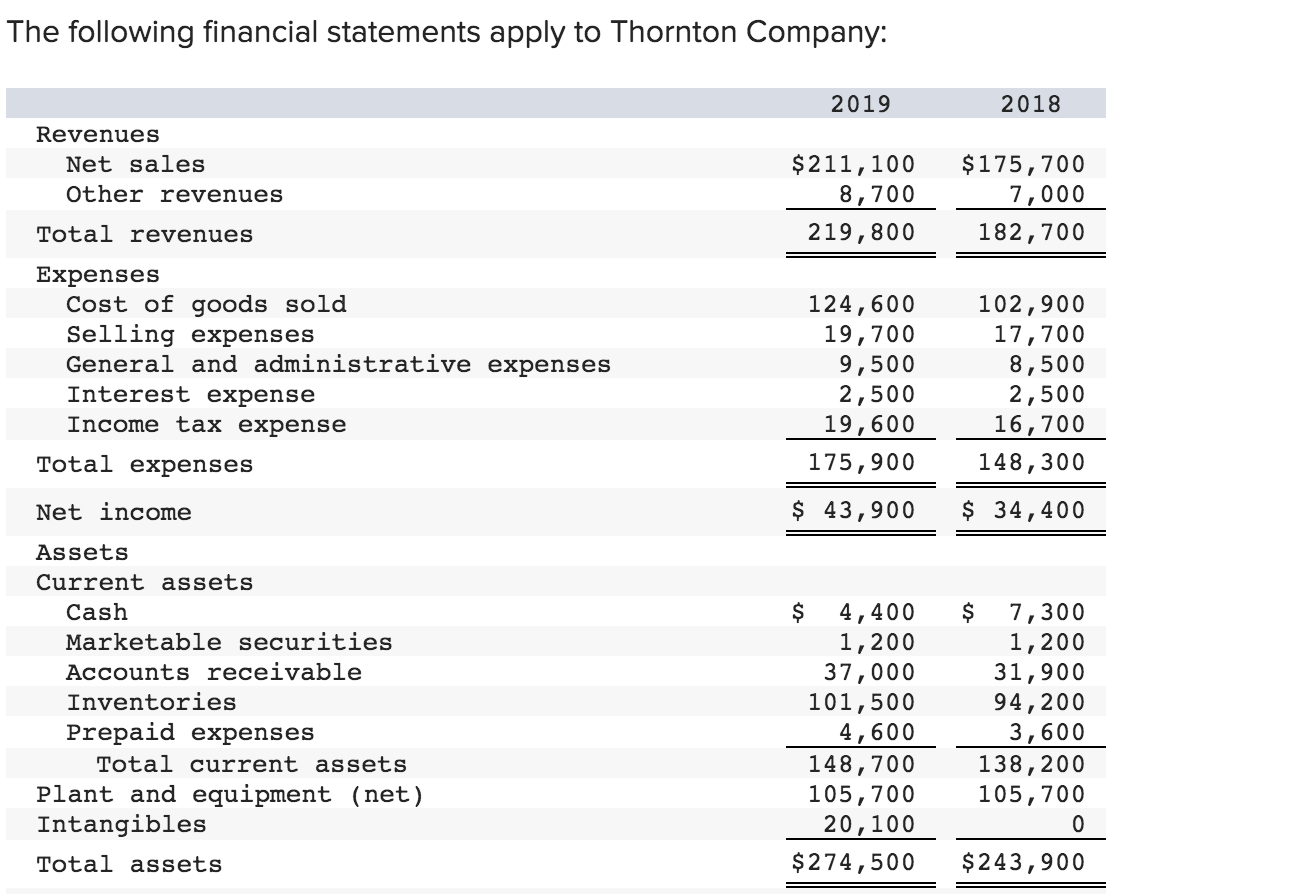
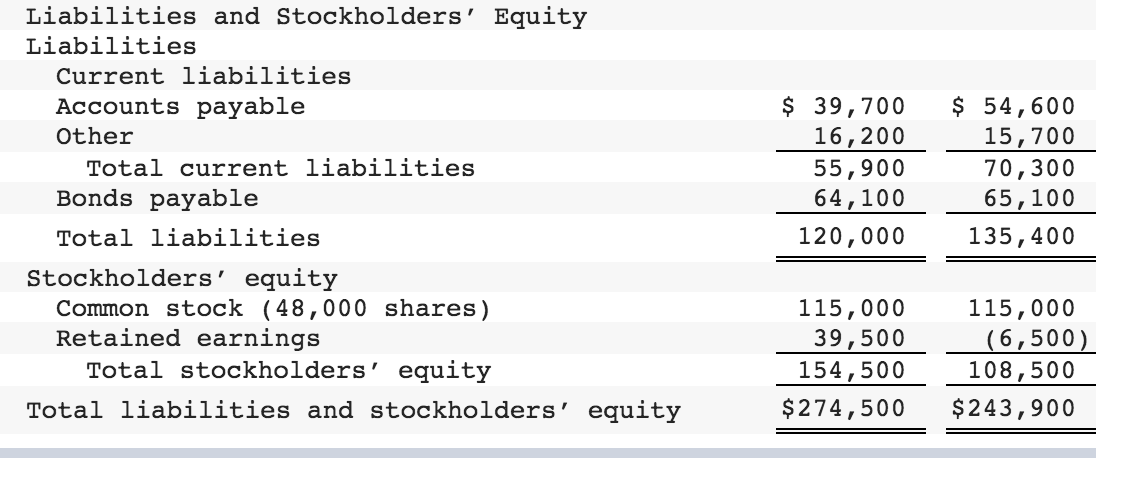
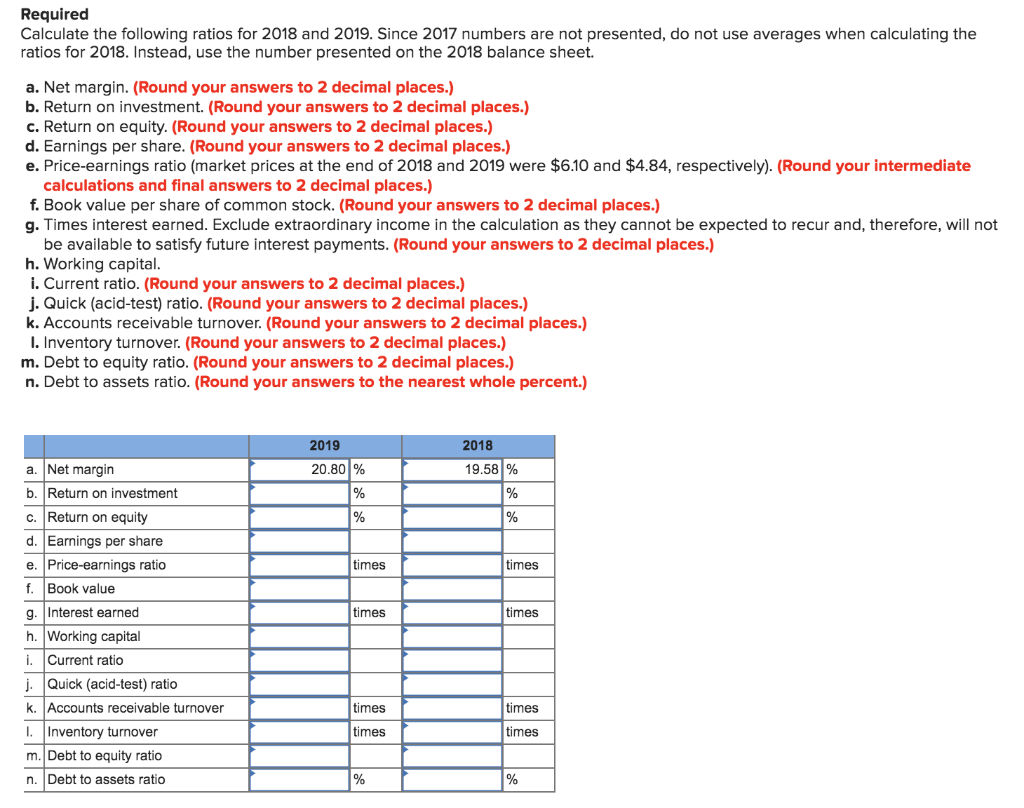
The following financial statements apply to Thornton Company: 2019 2018 Revenues Net sales Other revenues Total revenues $211,100 8,700 219,800 $175,700 7,000 182,700 Expenses Cost of goods sold Selling expenses General and administrative expenses Interest expense Income tax expense Total expenses 124,600 19,700 9,500 2,500 19,600 102,900 17,700 8,500 2,500 16,700 148,300 175,900 Net income $ 43,900 $ 34,400 Assets Current assets Cash Marketable securities Accounts receivable Inventories Prepaid expenses Total current assets Plant and equipment (net) Intangibles $ 4,400 1,200 37,000 101,500 4,600 148,700 105,700 20,100 $274,500 $ 7,300 1,200 31,900 94,200 3,600 138,200 105,700 VU Total assets $243,900 Liabilities and Stockholders' Equity Liabilities Current liabilities Accounts payable Other Total current liabilities Bonds payable Total liabilities Stockholders' equity Common stock (48,000 shares) Retained earnings Total stockholders' equity Total liabilities and stockholders' equity $ 39,700 16, 200 55,900 64,100 120,000 $ 54,600 15,700 70,300 65,100 135,400 115,000 39,500 154,500 $274,500 115,000 (6,500) 108,500 $243,900 Required Calculate the following ratios for 2018 and 2019. Since 2017 numbers are not presented, do not use averages when calculating the ratios for 2018. Instead, use the number presented on the 2018 balance sheet. a. Net margin. (Round your answers to 2 decimal places.) b. Return on investment. (Round your answers to 2 decimal places.) c. Return on equity. (Round your answers to 2 decimal places.) d. Earnings per share. (Round your answers to 2 decimal places.) e. Price-earnings ratio (market prices at the end of 2018 and 2019 were $6.10 and $4.84, respectively). (Round your intermediate calculations and final answers to 2 decimal places.) f. Book value per share of common stock. (Round your answers to 2 decimal places.) g. Times interest earned. Exclude extraordinary income in the calculation as they cannot be expected to recur and, therefore, will not be available to satisfy future interest payments. (Round your answers to 2 decimal places.) h. Working capital. i. Current ratio. (Round your answers to 2 decimal places.) j. Quick (acid-test) ratio. (Round your answers to 2 decimal places.) k. Accounts receivable turnover. (Round your answers to 2 decimal places.) 1. Inventory turnover. (Round your answers to 2 decimal places.) m. Debt to equity ratio. (Round your answers to 2 decimal places.) n. Debt to assets ratio. (Round your answers to the nearest whole percent.) 2019 20.80 % 2018 19.58 % times times times times a. Net margin b. Return on investment c. Return on equity d. Earnings per share e. Price-earnings ratio f. Book value g. Interest earned h. Working capital i. Current ratio j. Quick (acid-test) ratio k. Accounts receivable turnover I. Inventory turnover m. Debt to equity ratio n. Debt to assets ratio times times times times % The following financial statements apply to Thornton Company: 2019 2018 Revenues Net sales Other revenues Total revenues $211,100 8,700 219,800 $175,700 7,000 182,700 Expenses Cost of goods sold Selling expenses General and administrative expenses Interest expense Income tax expense Total expenses 124,600 19,700 9,500 2,500 19,600 102,900 17,700 8,500 2,500 16,700 148,300 175,900 Net income $ 43,900 $ 34,400 Assets Current assets Cash Marketable securities Accounts receivable Inventories Prepaid expenses Total current assets Plant and equipment (net) Intangibles $ 4,400 1,200 37,000 101,500 4,600 148,700 105,700 20,100 $274,500 $ 7,300 1,200 31,900 94,200 3,600 138,200 105,700 VU Total assets $243,900 Liabilities and Stockholders' Equity Liabilities Current liabilities Accounts payable Other Total current liabilities Bonds payable Total liabilities Stockholders' equity Common stock (48,000 shares) Retained earnings Total stockholders' equity Total liabilities and stockholders' equity $ 39,700 16, 200 55,900 64,100 120,000 $ 54,600 15,700 70,300 65,100 135,400 115,000 39,500 154,500 $274,500 115,000 (6,500) 108,500 $243,900 Required Calculate the following ratios for 2018 and 2019. Since 2017 numbers are not presented, do not use averages when calculating the ratios for 2018. Instead, use the number presented on the 2018 balance sheet. a. Net margin. (Round your answers to 2 decimal places.) b. Return on investment. (Round your answers to 2 decimal places.) c. Return on equity. (Round your answers to 2 decimal places.) d. Earnings per share. (Round your answers to 2 decimal places.) e. Price-earnings ratio (market prices at the end of 2018 and 2019 were $6.10 and $4.84, respectively). (Round your intermediate calculations and final answers to 2 decimal places.) f. Book value per share of common stock. (Round your answers to 2 decimal places.) g. Times interest earned. Exclude extraordinary income in the calculation as they cannot be expected to recur and, therefore, will not be available to satisfy future interest payments. (Round your answers to 2 decimal places.) h. Working capital. i. Current ratio. (Round your answers to 2 decimal places.) j. Quick (acid-test) ratio. (Round your answers to 2 decimal places.) k. Accounts receivable turnover. (Round your answers to 2 decimal places.) 1. Inventory turnover. (Round your answers to 2 decimal places.) m. Debt to equity ratio. (Round your answers to 2 decimal places.) n. Debt to assets ratio. (Round your answers to the nearest whole percent.) 2019 20.80 % 2018 19.58 % times times times times a. Net margin b. Return on investment c. Return on equity d. Earnings per share e. Price-earnings ratio f. Book value g. Interest earned h. Working capital i. Current ratio j. Quick (acid-test) ratio k. Accounts receivable turnover I. Inventory turnover m. Debt to equity ratio n. Debt to assets ratio times times times times %