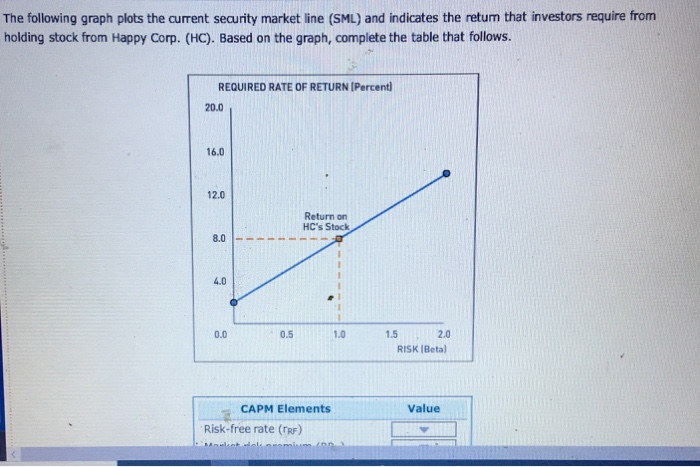
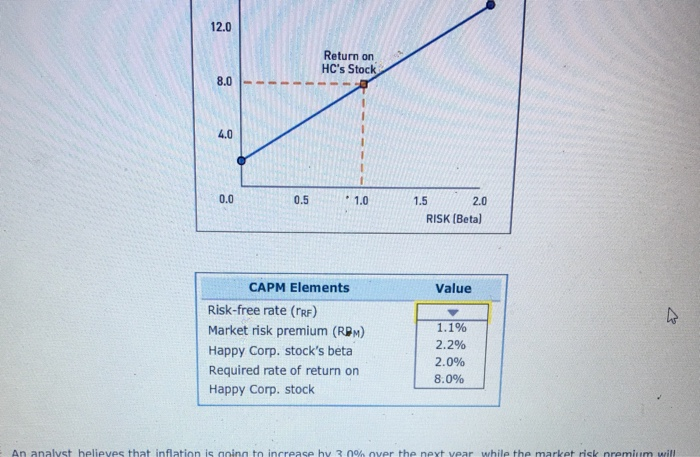
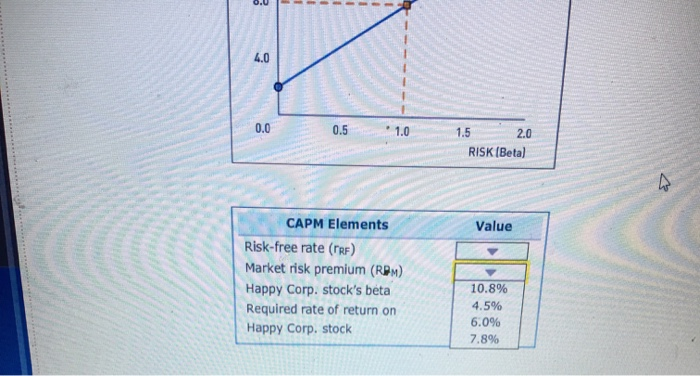
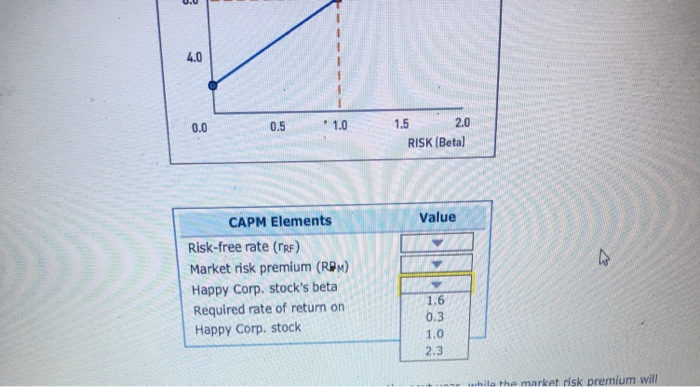
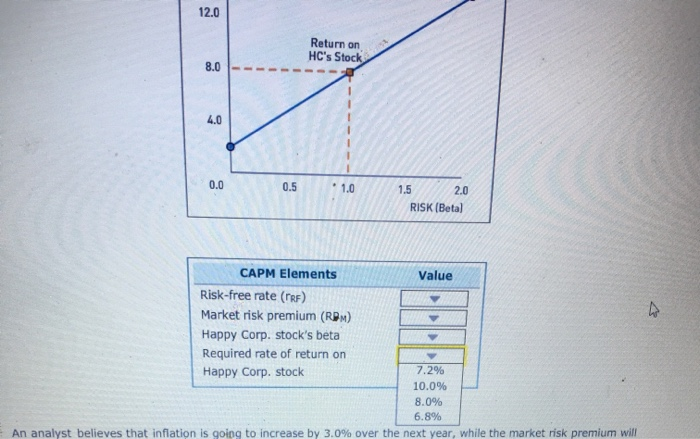
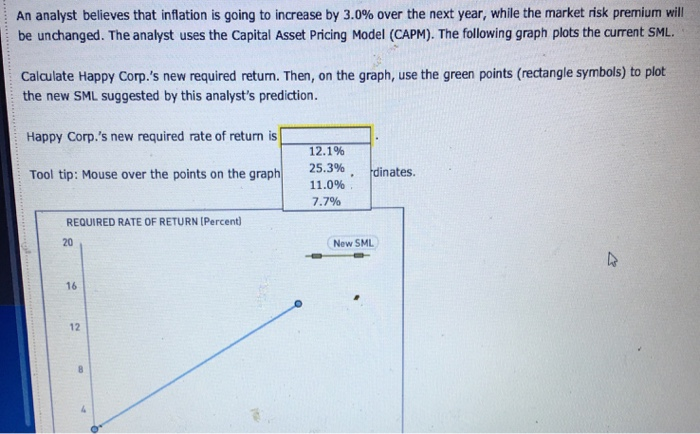
The following graph plots the current security market line (SML) and indicates the retum that investors require from holding stock from Happy Corp. (HC). Based on the graph, complete the table that follows. REQUIRED RATE OF RETURN (Percent) 20.0 16.0 12.0 Return on HC's Stock 8.0 4.0 1 0.0 0.5 1.0 1.5 2.0 RISK (Beta) Value CAPM Elements Risk-free rate (RF) Metricknamim 12.0 Return on HC's Stock 8.0 4.0 0.0 0.5 1.0 1.5 2.0 RISK (Beta) Value CAPM Elements Risk-free rate (TRF) Market risk premium (RPM) Happy Corp. stock's beta Required rate of return on Happy Corp. stock 1.1% 2.2% 2.0% 8.0% An analyst believes that inflation is going to increase hy 3.00% over the next year while the market risk premium will 3.U - 4.0 0.0 0.5 1.0 1.5 2.0 RISK (Beta) 4 Value CAPM Elements Risk-free rate (TRF) Market risk premium (RPM) Happy Corp. stock's beta Required rate of return on Happy Corp. stock 10.8% 4.5% 6.0% 7.8% 0.0 4.0 0.0 0.5 1.0 1.5 2.0 RISK (Beta) Value CAPM Elements Risk-free rate (RF) Market risk premium (RPM) Happy Corp. stock's beta Required rate of return on Happy Corp. stock 1.6 0.3 1.0 2.3 while the market risk premium will 12.0 Return on HC's Stock 8.0 - 4.0 0.0 in 1.0 1.5 2.0 RISK (Beta) CAPM Elements Value Risk-free rate (TRF) Market risk premium (RPM) Happy Corp. stock's beta Required rate of return on Happy Corp. stock 7.2% 10.0% 8.0% 6.8% An analyst believes that inflation is going to increase by 3.0% over the next year, while the market risk premium will An analyst believes that inflation is going to increase by 3.0% over the next year, while the market risk premium will be unchanged. The analyst uses the Capital Asset Pricing Model (CAPM). The following graph plots the current SML. Calculate Happy Corp.'s new required return. Then, on the graph, use the green points (rectangle symbols) to plot the new SML suggested by this analyst's prediction. Happy Corp.'s new required rate of return is Tool tip: Mouse over the points on the graph 12.1% 25.3% 11.0% 7.7% dinates REQUIRED RATE OF RETURN (Percent) 20 New SML 16 12 8 0 0.0 0.4 0.8 1.2 1.6 2.0 RISK (Beta) Clear All The SML helps determine the risk-aversion level among investors. The steeper the slope of the SML, the the level of risk aversion. higher lower Which of the following statements best describes a shift in the SML caused by increased risk aversion? The risk-free rate will remain constant. The risk-free rate will decrease. The risk-free rate will increase