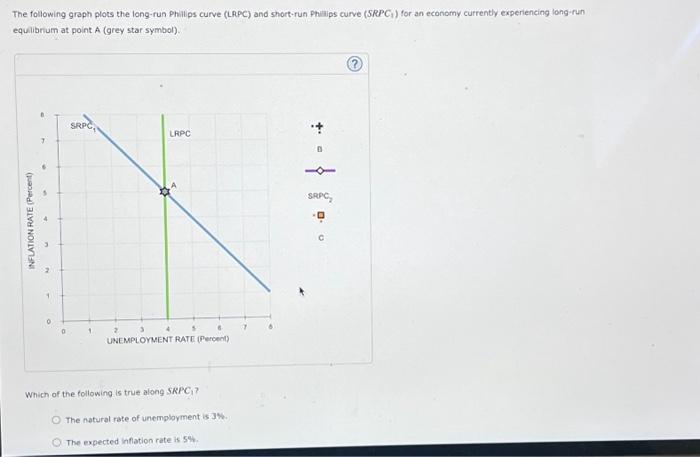
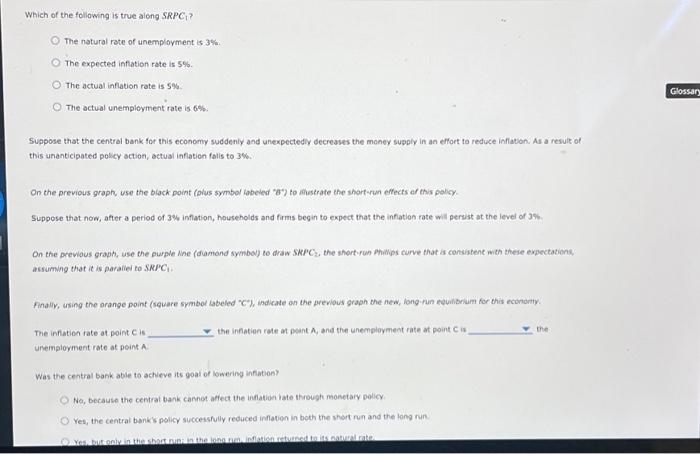
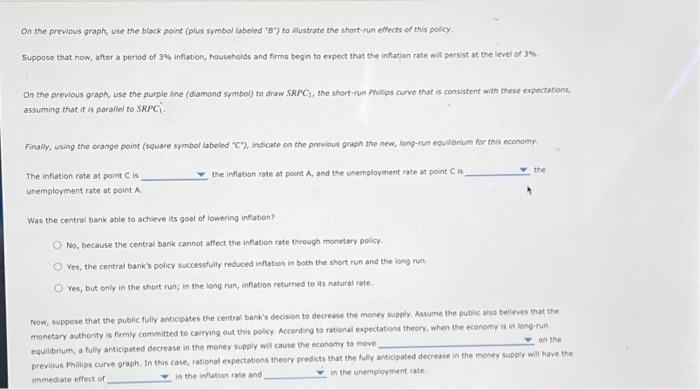
The following graph plots the long-run Phillps curve (LRPC) and short-run Philips curve (SRPC,) for an economy currently experiencing long-run equilibrium at point A (grey star symbol). Which of the following is true along SRPC The natural rate of unemployment is aW. The expected inflation rate is 59 Which of the following is true along SRPC ? The natural rate of unemplayment is 3% : The expected infation rate is 5%. The actual intlation rate is 5%. The actual unemployment rate is 6% : Suppose that the central bank for this economy suddenly and unexpectedy decreases the money supply in an effort to reduce infaton. As a resuit of this unanticipated policy sction, actual inflatien fatis to 3%. On the previous graph, use the black point (plus symbol lobeled "a") to alustrate the short-run effects af this policy. Suppose that now, after a period of 3% inflation, households and firms begin to expect that the infation rate will perwst at the level of J\%w. On the previous graph, use the purple Nhe (damond symbou) te draw SKPC2, the short run Phimps curve that as consistent mith these expectatione. acsumng that it is paraliei to $NPC1. The infation rate of point C is unemployment rate at point A. Was the central bank able to acheve its goal of lowering infation? No, because the centrat bank cannot affect the inflation iate tirough monetary policy Yes, the central bank's policy successfully reduced infation in both the short run and the long run. On the previous graphy use the block point (plus symbol labeled "B") to illustrate bhe shortrun effects of this policy. 5upposo that now, after a period of 3% inflation, houceholds and firms begin to expect that the inflation rate aill persist at the level of Jos On the previous graph, use the purple line (diamond symbol) to draw SRPC., the short run phitlips curve that is consistent with these expectations, assuming that it is parallel to SRPC Finally, using the orange point (square symbol labeled "C"), indicate on the previous graph the new, long-run equllarium for this economy The infiotion rate at point C is the infiation rate at point A, and the unemployment rate at point C is unemployment rate at point A. Was the central bank able to achieve its goal of lowering intlation? No, because the central bank cannot affect the inflation rate through monetary policy. Yes, the central bank's policy successtully reduced infiabion in both the short run and the long run Yes, but oaly in the short ran, in the long rum, inflation returned to its natural rate. Now, suppose that the public fully anticipates the central bank's decision to detreate the meney supply Asume the public also belitres that the monetary authority is fermly cormimitted to carrying out this policy. According to rational expectations thecry. when the econerey is in long-run equilibrium, a fully anticipated decrease in the money wwply wil couse the economy to move. an the previous Phimios curve graph, In this case, rational expectations theory presicts that the fully anticisated decomele in the money supply wil have thit immediate effect of in the inflation rate and in the cinemployment rate


