Answered step by step
Verified Expert Solution
Link Copied!

Question

1 Approved Answer

The following graph represents the Profile of the Net Present Values (NPV Profile) for Projects A and B. Both projects have the same duration, the
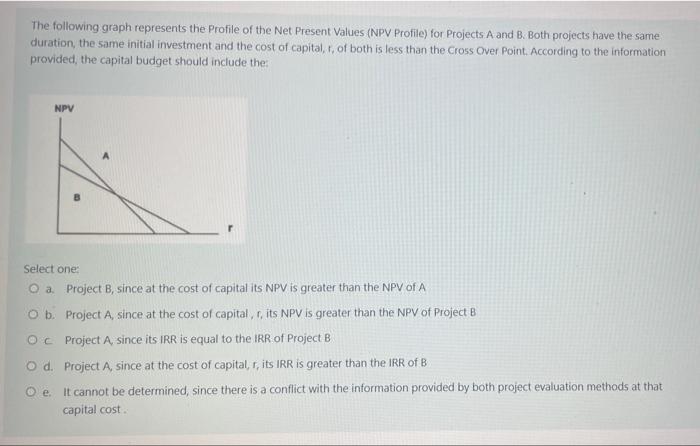
image text in transcribed
The following graph represents the Profile of the Net Present Values (NPV Profile) for Projects A and B. Both projects have the same duration, the same initial investment and the cost of capital, r, of both is less than the Cross Over Point. According to the information provided, the capital budget should include the: NPV Select one: O a Project B, since at the cost of capital its NPV is greater than the NPV of A O b. Project A, since at the cost of capital, r, its NPV is greater than the NPV of Project B Oc Project A, since its IRR is equal to the IRR of Project B O d. Project A, since at the cost of capital, r, its IRR is greater than the IRR of B Oe. It cannot be determined, since there is a conflict with the information provided by both project evaluation methods at that capital cost

Step by Step Solution

There are 3 Steps involved in it

Step: 1

blur-text-image

Get Instant Access to Expert-Tailored Solutions

See step-by-step solutions with expert insights and AI powered tools for academic success

Step: 2

blur-text-image

Step: 3

blur-text-image

Ace Your Homework with AI

Get the answers you need in no time with our AI-driven, step-by-step assistance

Get Started

Recommended Textbook for

Chains Of Finance How Investment Management Is Shaped

Authors: Diane-Laure Arjalies, Philip Grant, Iain Hardie, Donald MacKenzie, Ekaterina Svetlova

1st Edition

0198802943, 978-0198802945

More Books

Students also viewed these Finance questions