Question
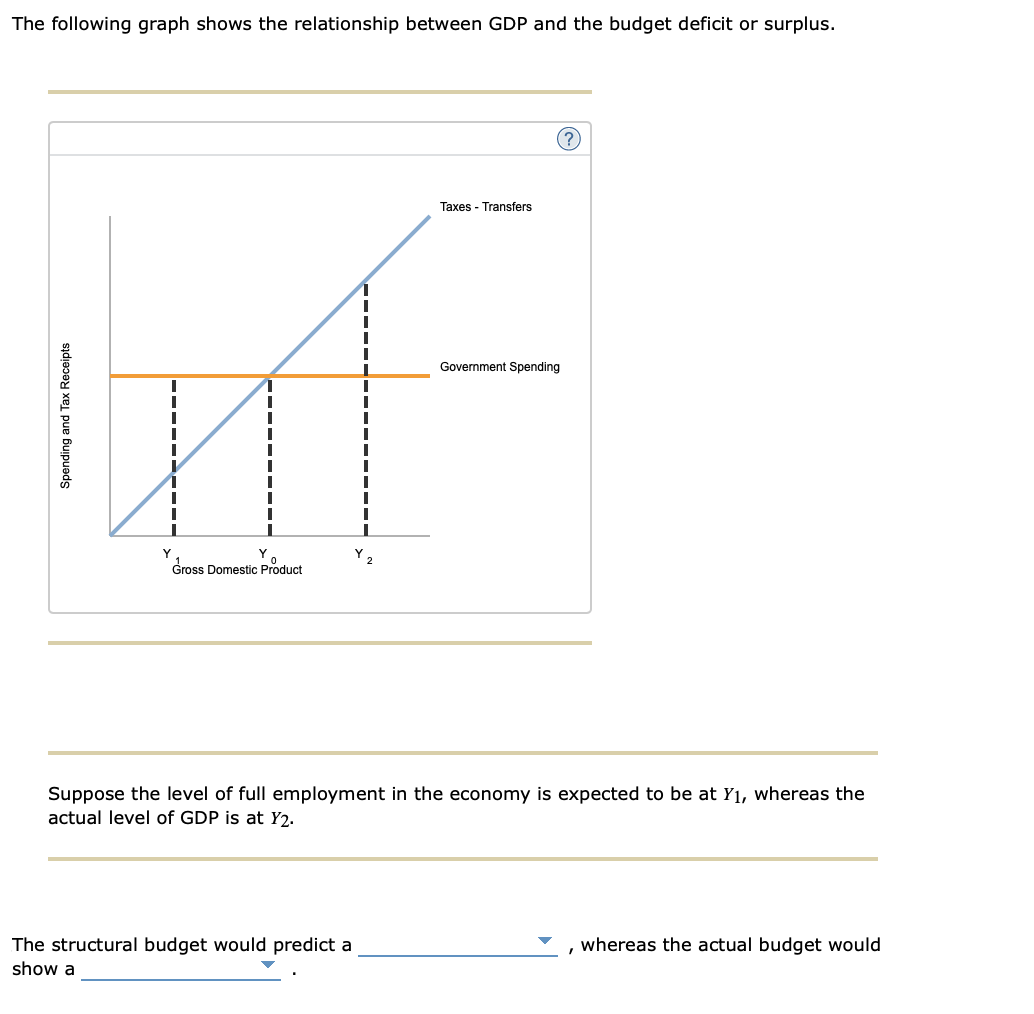
The following graph shows the relationship between GDP and the budget deficit or surplus. Spending and Tax Receipts Y Y Gross Domestic Product

The following graph shows the relationship between GDP and the budget deficit or surplus. Spending and Tax Receipts " Y Y Gross Domestic Product Y The structural budget would predict a show a Taxes - Transfers (?) Government Spending Suppose the level of full employment in the economy is expected to be at Y, whereas the actual level of GDP is at Y2. whereas the actual budget would
Step by Step Solution
3.38 Rating (160 Votes )
There are 3 Steps involved in it
Step: 1
The graph shows the relationship between GDP and the budget deficit or surplus The vertical axis sho...
Get Instant Access to Expert-Tailored Solutions
See step-by-step solutions with expert insights and AI powered tools for academic success
Step: 2

Step: 3

Ace Your Homework with AI
Get the answers you need in no time with our AI-driven, step-by-step assistance
Get StartedRecommended Textbook for
Principles of Macroeconomics
Authors: Karl E. Case, Ray C. Fair, Sharon E. Oster
12th edition
134078802, 978-0134078809
Students also viewed these Economics questions
Question
Answered: 1 week ago
Question
Answered: 1 week ago
Question
Answered: 1 week ago
Question
Answered: 1 week ago
Question
Answered: 1 week ago
Question
Answered: 1 week ago
Question
Answered: 1 week ago
Question
Answered: 1 week ago
Question
Answered: 1 week ago
Question
Answered: 1 week ago
Question
Answered: 1 week ago
Question
Answered: 1 week ago
Question
Answered: 1 week ago
Question
Answered: 1 week ago
Question
Answered: 1 week ago
Question
Answered: 1 week ago
Question
Answered: 1 week ago
Question
Answered: 1 week ago
Question
Answered: 1 week ago
Question
Answered: 1 week ago
Question
Answered: 1 week ago
Question
Answered: 1 week ago
View Answer in SolutionInn App


