

Answered step by step
Verified Expert Solution
Question
1 Approved Answer
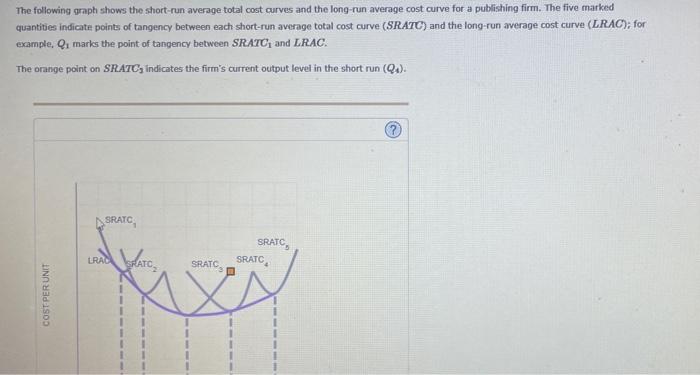
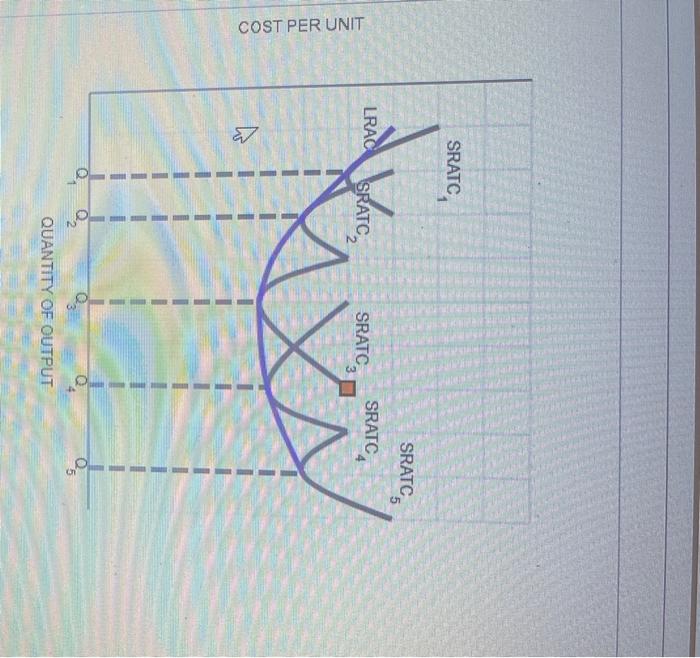
The following graph shows the short-run average total cost curves and the long-run average cost curve for a publishing firm. The five marked quantities indicate
Step by Step Solution
There are 3 Steps involved in it
Step: 1

Get Instant Access to Expert-Tailored Solutions
See step-by-step solutions with expert insights and AI powered tools for academic success
Step: 2

Step: 3
Ace Your Homework with AI
Get the answers you need in no time with our AI-driven, step-by-step assistance
Get Started
Finance Business Discover Types Of Audits Balance Sheets And Assertions
Authors: Carleen Legalley
1st Edition
B0B5KVD4FZ, 979-8839194779