Question
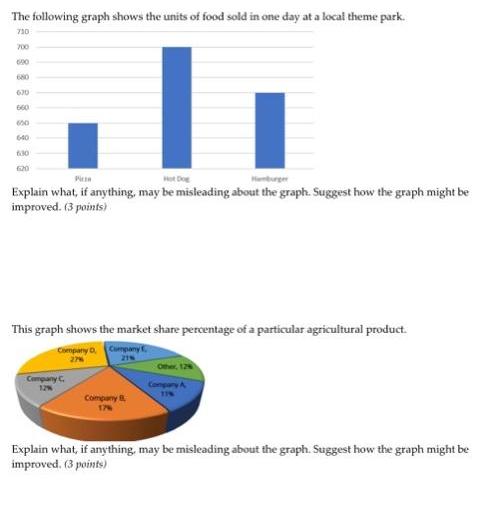
The following graph shows the units of food sold in one day at a local theme park. 710 700 680 630 660 600 640

The following graph shows the units of food sold in one day at a local theme park. 710 700 680 630 660 600 640 6:30 6:20 Pien Hot Dog Explain what, if anything, may be misleading about the graph. Suggest how the graph might be improved. (3 points) This graph shows the market share percentage of a particular agricultural product. Company D, Company 27% Company C Company B Company A Explain what, if anything, may be misleading about the graph. Suggest how the graph might be improved. (3 points)
Step by Step Solution
3.40 Rating (147 Votes )
There are 3 Steps involved in it
Step: 1
1 The vertical axis starting with 620 is misleading and in o...
Get Instant Access to Expert-Tailored Solutions
See step-by-step solutions with expert insights and AI powered tools for academic success
Step: 2

Step: 3

Ace Your Homework with AI
Get the answers you need in no time with our AI-driven, step-by-step assistance
Get StartedRecommended Textbook for
Operations Management Creating Value Along the Supply Chain
Authors: Roberta S. Russell, Bernard W. Taylor, Ignacio Castillo, Navneet Vidyarthi
1st Canadian Edition
978-1-118-3011, 1118942051, 1118942055, 978-1118301173
Students also viewed these Mathematics questions
Question
Answered: 1 week ago
Question
Answered: 1 week ago
Question
Answered: 1 week ago
Question
Answered: 1 week ago
Question
Answered: 1 week ago
Question
Answered: 1 week ago
Question
Answered: 1 week ago
Question
Answered: 1 week ago
Question
Answered: 1 week ago
Question
Answered: 1 week ago
Question
Answered: 1 week ago
Question
Answered: 1 week ago
Question
Answered: 1 week ago
Question
Answered: 1 week ago
Question
Answered: 1 week ago
Question
Answered: 1 week ago
Question
Answered: 1 week ago
Question
Answered: 1 week ago
Question
Answered: 1 week ago
Question
Answered: 1 week ago
Question
Answered: 1 week ago
Question
Answered: 1 week ago
View Answer in SolutionInn App


