Question
The following histogram' shows the percentage of workers (16 and older) in each of the 136 U.S. counties surveyed who drove alone to work


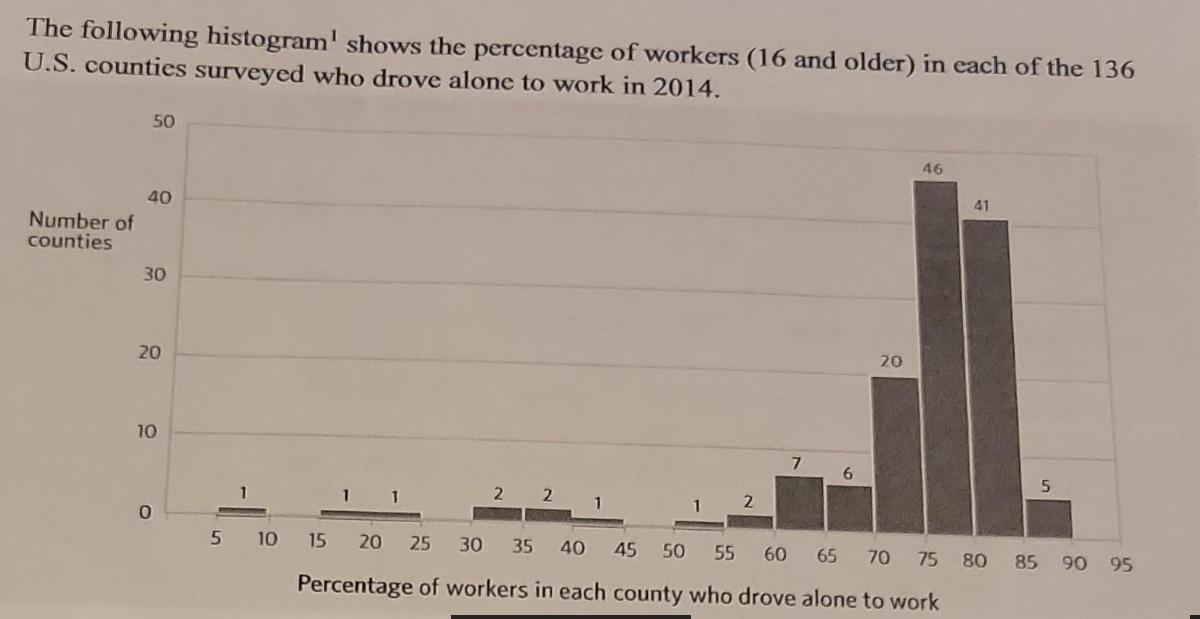
The following histogram' shows the percentage of workers (16 and older) in each of the 136 U.S. counties surveyed who drove alone to work in 2014. Number of counties 50 40 30 20 10 0 5 1 1 10 15 2 2 1 7 6 20 46 41 20 25 30 35 40 45 50 55 60 65 70 75 80 Percentage of workers in each county who drove alone to work 85 90 95 In how many counties, 5% or fewer workers drove alone to work? Calculate the approximate 5th percentile of these data. Write a data range within which the 1st quartile of the data will fall. Write a data range within which the median of the data will fall.
Step by Step Solution
3.40 Rating (166 Votes )
There are 3 Steps involved in it
Step: 1
StepbyStep Solution 0 countries workers drove alone to work 5 or fewer 5th percentile i...
Get Instant Access to Expert-Tailored Solutions
See step-by-step solutions with expert insights and AI powered tools for academic success
Step: 2

Step: 3

Ace Your Homework with AI
Get the answers you need in no time with our AI-driven, step-by-step assistance
Get StartedRecommended Textbook for
Income Tax Fundamentals 2013
Authors: Gerald E. Whittenburg, Martha Altus Buller, Steven L Gill
31st Edition
1111972516, 978-1285586618, 1285586611, 978-1285613109, 978-1111972516
Students also viewed these Mathematics questions
Question
Answered: 1 week ago
Question
Answered: 1 week ago
Question
Answered: 1 week ago
Question
Answered: 1 week ago
Question
Answered: 1 week ago
Question
Answered: 1 week ago
Question
Answered: 1 week ago
Question
Answered: 1 week ago
Question
Answered: 1 week ago
Question
Answered: 1 week ago
Question
Answered: 1 week ago
Question
Answered: 1 week ago
Question
Answered: 1 week ago
Question
Answered: 1 week ago
Question
Answered: 1 week ago
Question
Answered: 1 week ago
Question
Answered: 1 week ago
Question
Answered: 1 week ago
Question
Answered: 1 week ago
Question
Answered: 1 week ago
Question
Answered: 1 week ago
View Answer in SolutionInn App


