Answered step by step
Verified Expert Solution
Question
1 Approved Answer
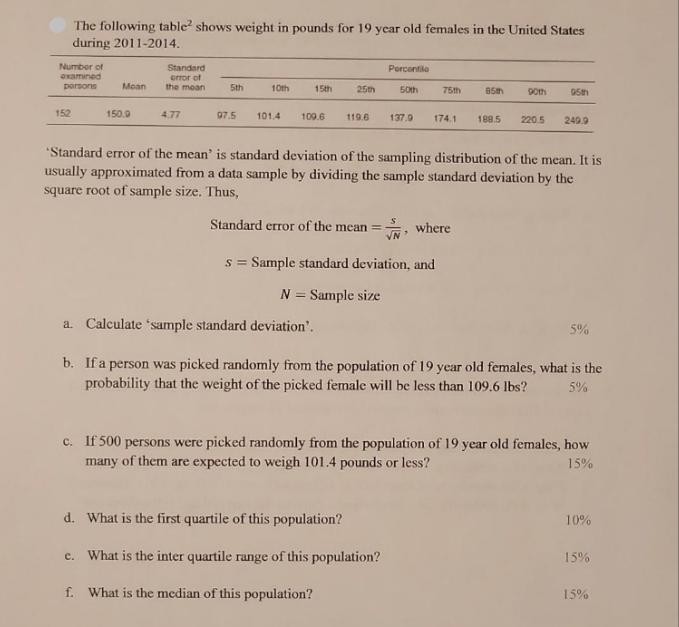
The following table shows weight in pounds for 19 year old females in the United States during 2011-2014. Number of examined parsons 152 Moan

The following table shows weight in pounds for 19 year old females in the United States during 2011-2014. Number of examined parsons 152 Moan 150.0 Standard error of the moan 4.77 5th 10th 97.5 101.4 15th 25th 109.6 119.6 137.0 Porcentila 50th a. Calculate 'sample standard deviation'. 75th Standard error of the mean = where VN s = Sample standard deviation, and N = Sample size 85th d. What is the first quartile of this population? e. What is the inter quartile range of this population? f. What is the median of this population? 90th 'Standard error of the mean' is standard deviation of the sampling distribution of the mean. It is usually approximated from a data sample by dividing the sample standard deviation by the square root of sample size. Thus, 95th 174.1 188.5 220.5 249.9 5% b. If a person was picked randomly from the population of 19 year old females, what is the probability that the weight of the picked female will be less than 109.6 lbs? 5% c. If 500 persons were picked randomly from the population of 19 year old females, how many of them are expected to weigh 101.4 pounds or less? 15% 10% 15% 15%
Step by Step Solution
★★★★★
3.42 Rating (165 Votes )
There are 3 Steps involved in it
Step: 1
a To calculate the sample standard deviation s we have the data for weight in pounds for 19yearold females 152 1509 477 975 1014 1096 1196 1379 1741 1...
Get Instant Access to Expert-Tailored Solutions
See step-by-step solutions with expert insights and AI powered tools for academic success
Step: 2

Step: 3

Ace Your Homework with AI
Get the answers you need in no time with our AI-driven, step-by-step assistance
Get Started


