

Answered step by step
Verified Expert Solution
Question
1 Approved Answer
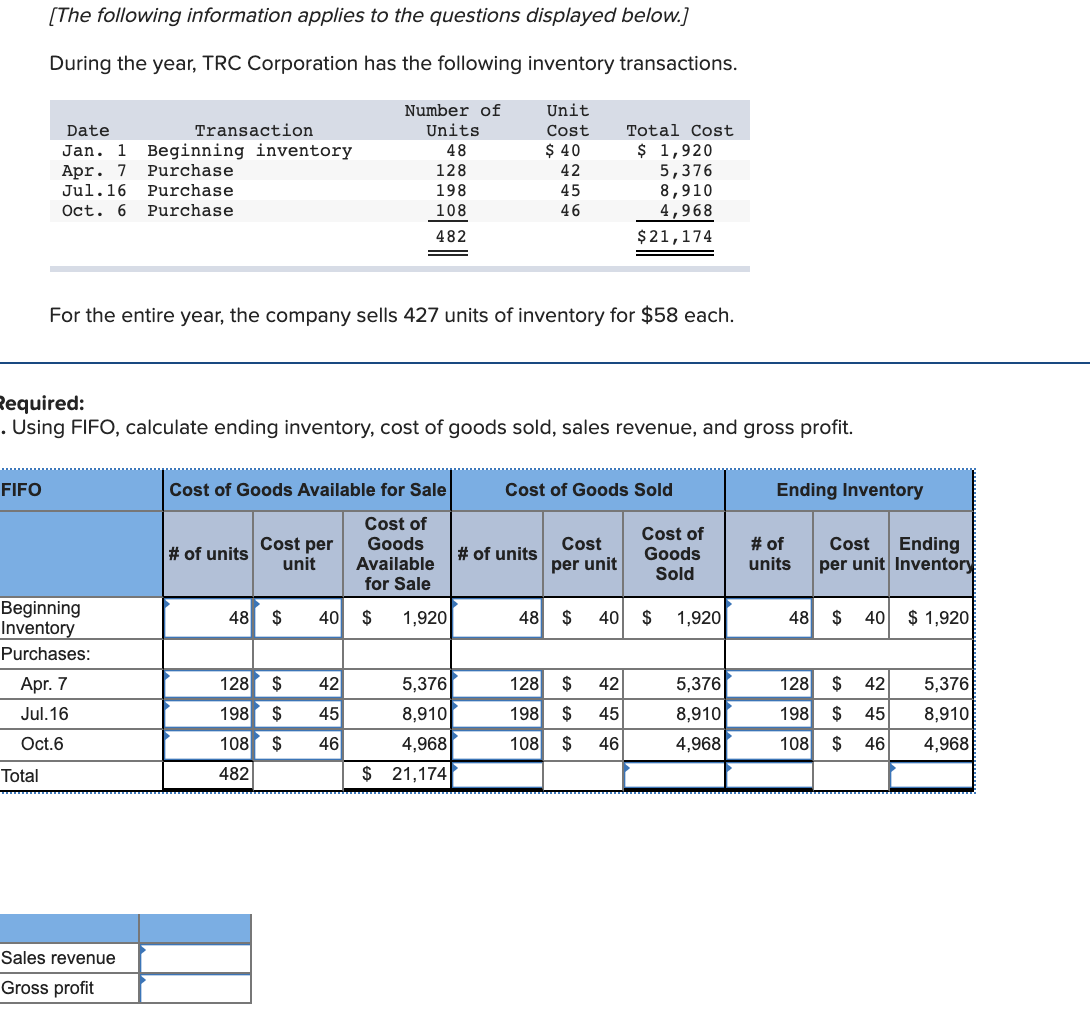
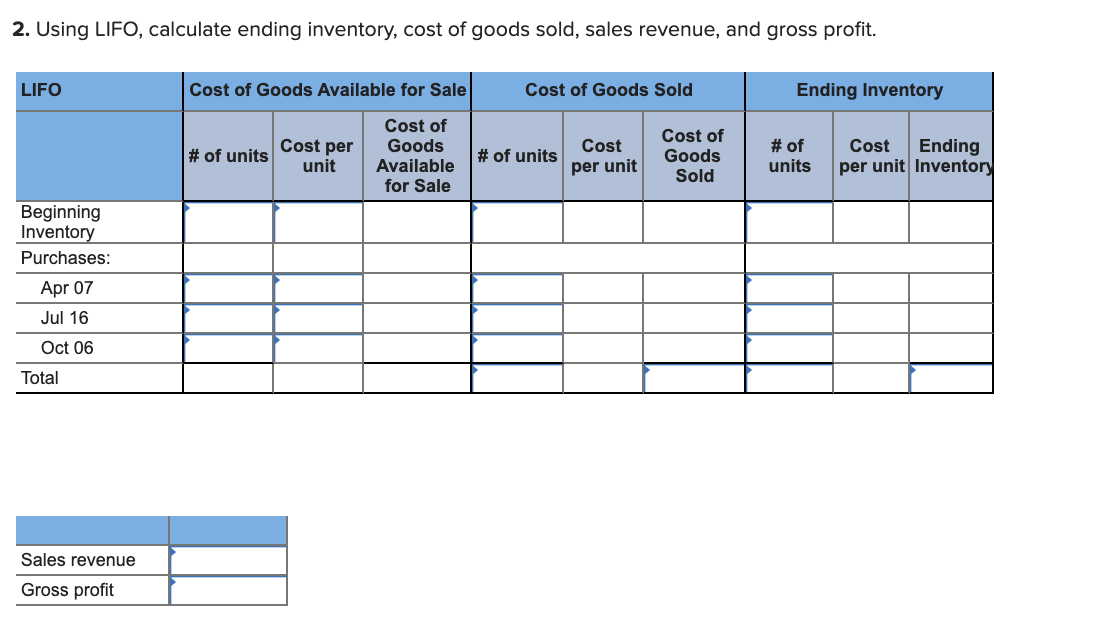
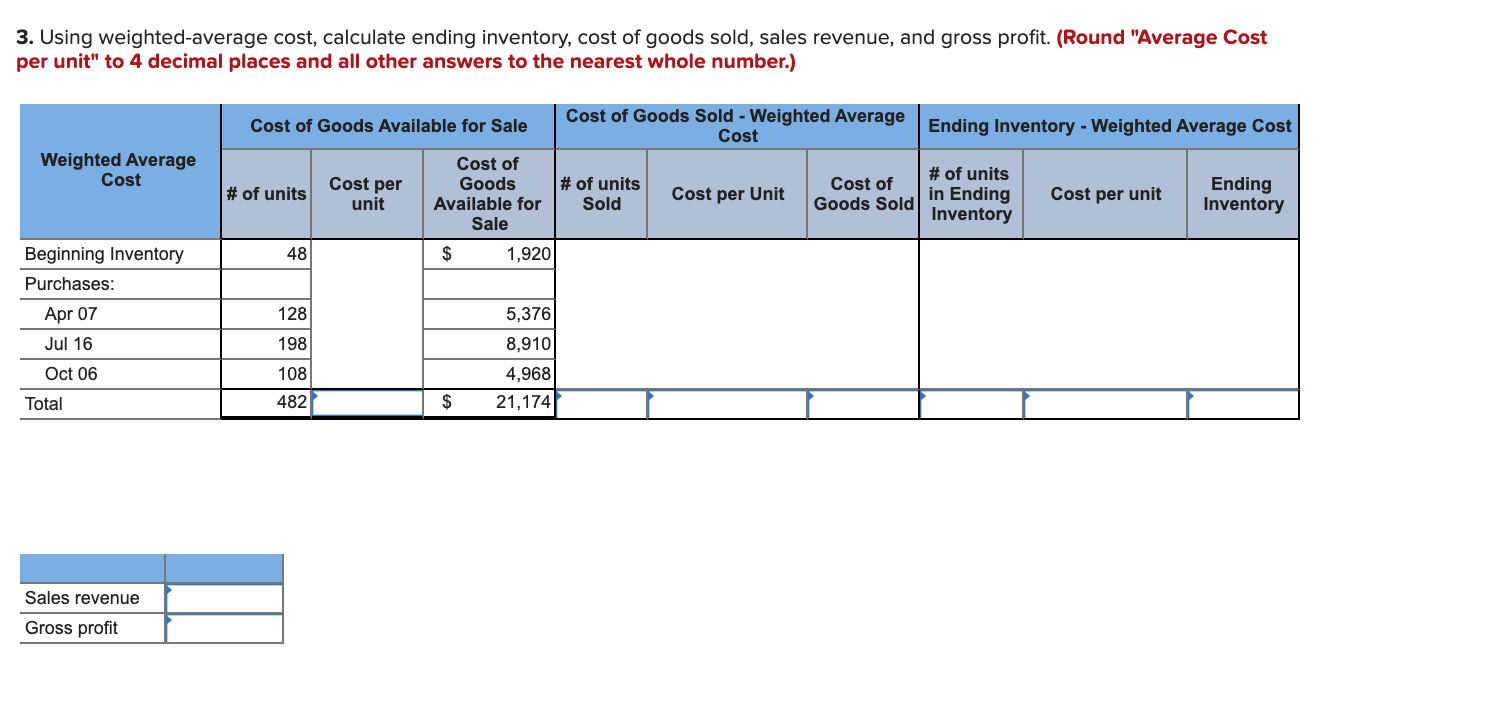
[The following information applies to the questions displayed below.) During the year, TRC Corporation has the following inventory transactions. Date Transaction Jan. 1 Beginning inventory
Step by Step Solution
There are 3 Steps involved in it
Step: 1

Get Instant Access to Expert-Tailored Solutions
See step-by-step solutions with expert insights and AI powered tools for academic success
Step: 2

Step: 3
Ace Your Homework with AI
Get the answers you need in no time with our AI-driven, step-by-step assistance
Get Started
Internal Auditors Manual And Guide The Practitioners Guide To Internal Auditing
Authors: Milton Stevens Fonorow
1st Edition
0134711947, 978-0134711942