Answered step by step
Verified Expert Solution
Link Copied!

Question

1 Approved Answer

[The following information applies to the questions displayed below.] Selected comparative financial statements of Korbin Company follow. KORBIN COMPANY Comparative Income Statements For Years Ended
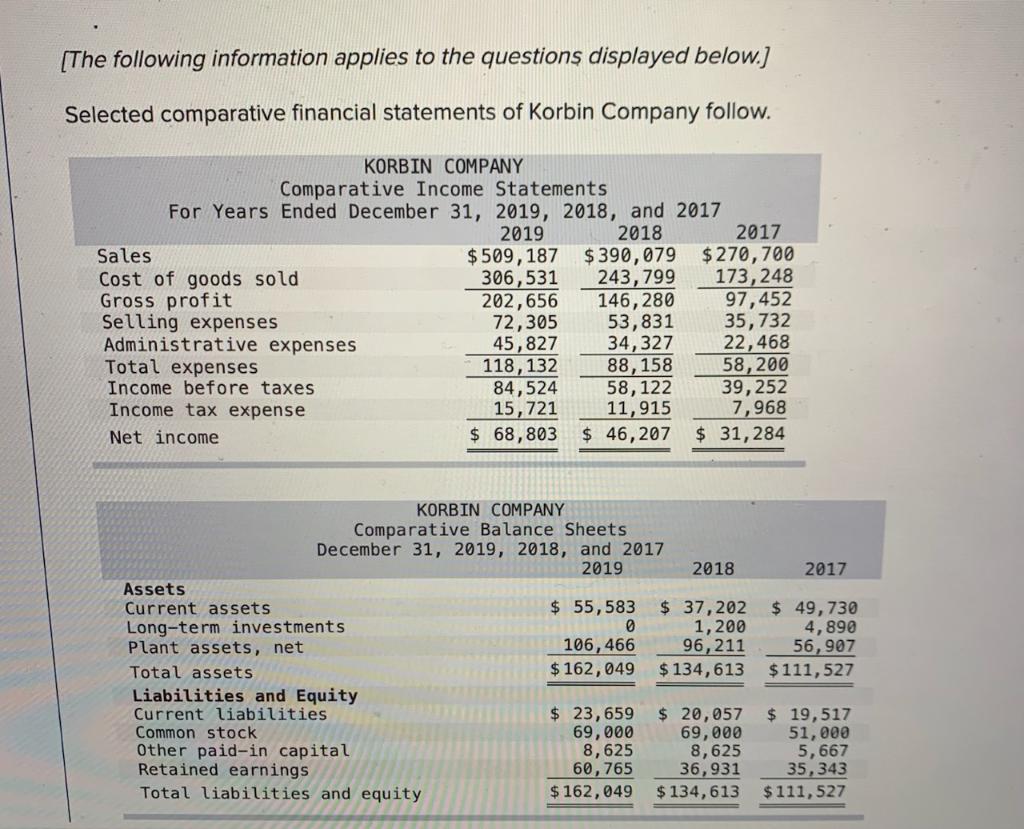
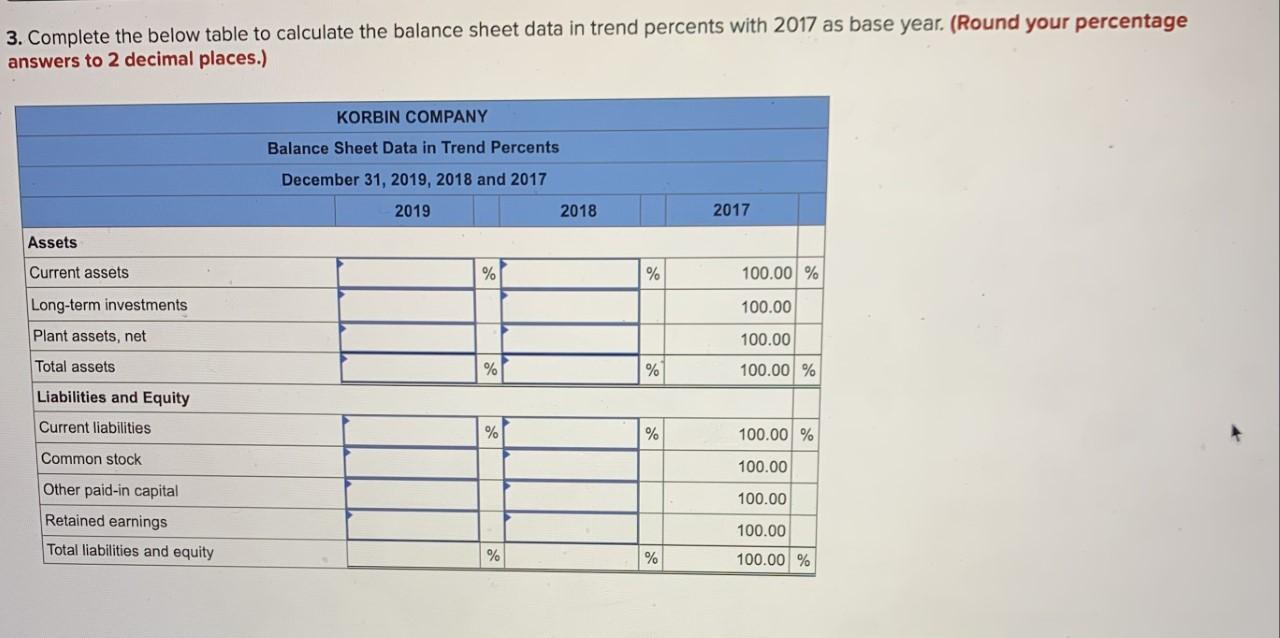
image text in transcribedimage text in transcribed

[The following information applies to the questions displayed below.] Selected comparative financial statements of Korbin Company follow. KORBIN COMPANY Comparative Income Statements For Years Ended December 31, 2019, 2018, and 2017 2019 2018 2017 Sales $509, 187 $ 390,079 $270,700 Cost of goods sold 306,531 243,799 173,248 Gross profit 202,656 146,280 97,452 Selling expenses 72,305 53,831 35,732 Administrative expenses 45,827 34,327 22,468 Total expenses 118, 132 88, 158 58,200 Income before taxes 84,524 58, 122 39, 252 Income tax expense 15,721 11,915 7,968 Net income $ 68,803 $ 46,207 $ 31,284 2017 KORBIN COMPANY Comparative Balance Sheets December 31, 2019, 2018, and 2017 2019 2018 Assets Current assets $ 55,583 $ 37,202 Long-term investments 0 1,200 Plant assets, net 106,466 96, 211 Total assets $ 162,049 $ 134,613 Liabilities and Equity Current liabilities $ 23,659 $ 20,057 Common stock 69,000 69,000 Other paid-in capital 8,625 8,625 Retained earnings 60, 765 36,931 Total liabilities and equity $ 162,049 $ 134,613 $ 49,730 4,890 56,907 $ 111,527 $ 19,517 51,000 5, 667 35, 343 $111,527 3. Complete the below table to calculate the balance sheet data in trend percents with 2017 as base year. (Round your percentage answers to 2 decimal places.) KORBIN COMPANY Balance Sheet Data in Trend Percents December 31, 2019, 2018 and 2017 2019 2018 2017 Assets Current assets % % 100.00 % Long-term investments 100.00 Plant assets, net 100.00 Total assets % % 100.00 % Liabilities and Equity Current liabilities % % 100.00 % Common stock 100.00 Other paid-in capital 100.00 Retained earnings 100.00 Total liabilities and equity % % 100.00 %

Step by Step Solution

There are 3 Steps involved in it

Step: 1

blur-text-image

Get Instant Access to Expert-Tailored Solutions

See step-by-step solutions with expert insights and AI powered tools for academic success

Step: 2

blur-text-image_2

Step: 3

blur-text-image_3

Ace Your Homework with AI

Get the answers you need in no time with our AI-driven, step-by-step assistance

Get Started

Recommended Textbook for

Auditing and Assurance Services Understanding the Integrated Audit

Authors: Karen L. Hooks

1st edition

471726346, 978-0471726340

More Books

Students also viewed these Accounting questions

Question

How Policies Influence the Trade Balance?

Answered: 1 week ago