Answered step by step
Verified Expert Solution
Question
1 Approved Answer
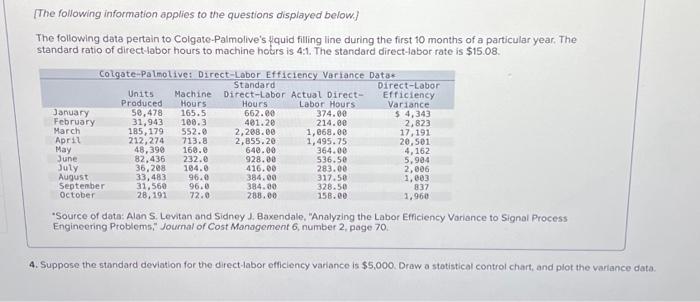
[The following information applies to the questions displayed below.] The following data pertain to Colgate-Palmolive's quid filling line during the first 10 months of a
[The following information applies to the questions displayed below.] The following data pertain to Colgate-Palmolive's quid filling line during the first 10 months of a particular year. The standard ratio of direct-labor hours to machine hours is 4:1. The standard direct-labor rate is $15.08. Colgate-Palmolive: Direct-Labor Efficiency Variance Data* Standard Direct-Labor Actual Direct- Hours Labor Hours Units Machine Produced Hours 50,478 165.5 31,943 100.3 185,179 552.0 212,274 713.8 48,390 160.0 82,436 232.0 36,208 104.0 33,483 96.0 31,560 96.0 72.0 28,191 January February March April May June July August September October 662.00 401.20 2,208.00 2,855.20 640.00 928.00 416.00 384.00 384.00 288.00 374.00 214.00 1,068.00 1,495.75 364.00 536.50 283.00 317.50 328.50 158.00 Direct-Labor Efficiency Variance $ 4,343 2,823 17,191 20,501 4,162 5,904 2,006 1,003 837 1,960 *Source of data: Alan S. Levitan and Sidney J. Baxendale, "Analyzing the Labor Efficiency Variance to Signal Process Engineering Problems," Journal of Cost Management 6, number 2, page 70. 4. Suppose the standard deviation for the direct-labor efficiency variance is $5,000. Draw a statistical control chart, and plot the variance data.

Step by Step Solution
There are 3 Steps involved in it
Step: 1

Get Instant Access to Expert-Tailored Solutions
See step-by-step solutions with expert insights and AI powered tools for academic success
Step: 2

Step: 3

Ace Your Homework with AI
Get the answers you need in no time with our AI-driven, step-by-step assistance
Get Started


