

Answered step by step
Verified Expert Solution
Question
1 Approved Answer
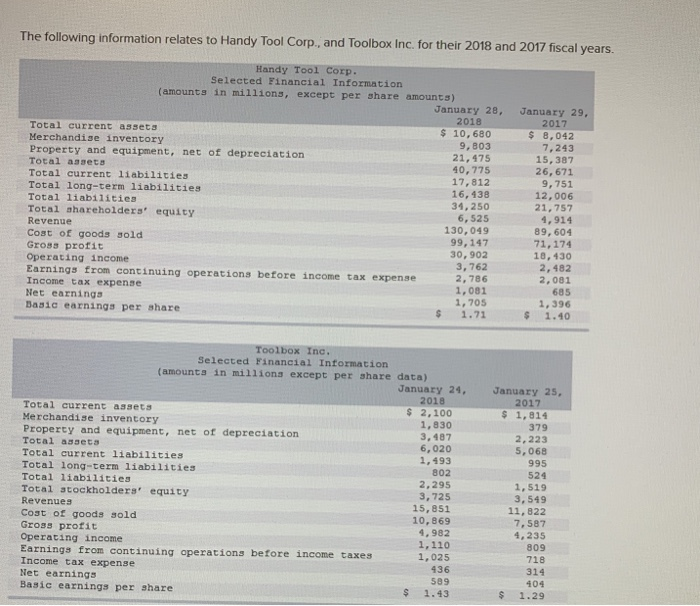
The following information relates to Handy Tool Corp., and Toolbox Inc. for their 2018 and 2017 fiscal years. Handy Tool Corp. Selected Financial Information (amounts
Step by Step Solution
There are 3 Steps involved in it
Step: 1

Get Instant Access to Expert-Tailored Solutions
See step-by-step solutions with expert insights and AI powered tools for academic success
Step: 2

Step: 3
Ace Your Homework with AI
Get the answers you need in no time with our AI-driven, step-by-step assistance
Get Started
Financial Shenanigans
Authors: Howard Schilit
2nd Edition
0071386262, 9780071386265