

Question: The following is a frequency table, showing the age distribution of a group of students in their twenties (that is, between age 20 and 29
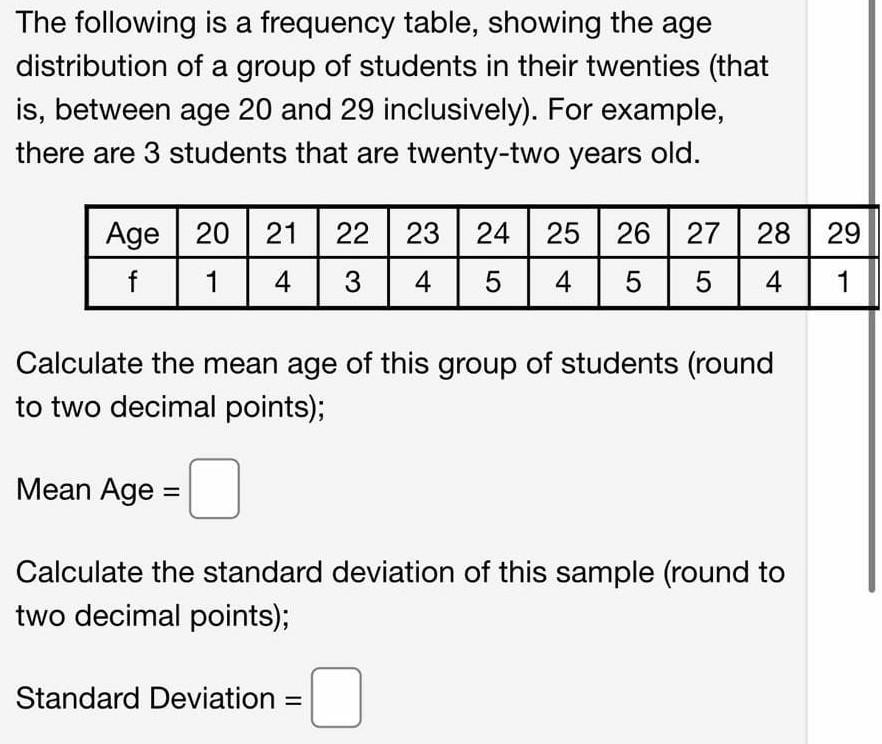
The following is a frequency table, showing the age distribution of a group of students in their twenties (that is, between age 20 and 29 inclusively). For example, there are 3 students that are twenty-two years old. Age | 20 21 22 23 24 25 26 27 27 28 29 4 5 5 4 1 f 1 4 3 4 5 Calculate the mean age of this group of students (round to two decimal points); Mean Age = Calculate the standard deviation of this sample (round to two decimal points); Standard Deviation =
Step by Step Solution
There are 3 Steps involved in it
1 Expert Approved Answer
Step: 1 Unlock

Question Has Been Solved by an Expert!
Get step-by-step solutions from verified subject matter experts
Step: 2 Unlock
Step: 3 Unlock