Answered step by step
Verified Expert Solution
Question
1 Approved Answer
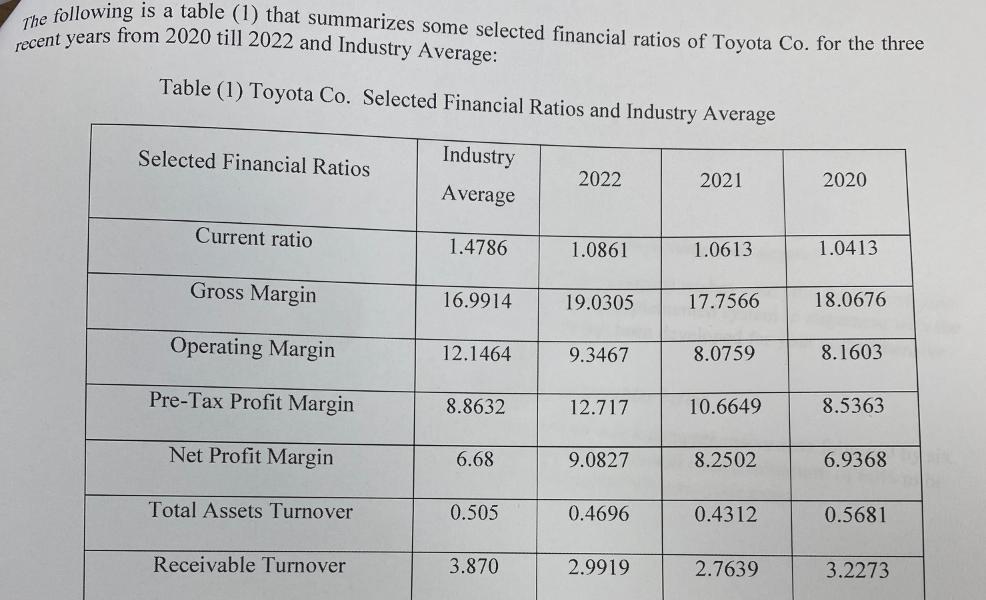
The following is a table (1) that summarizes some selected financial ratios of Toyota Co. for the three recent years from 2020 till 2022


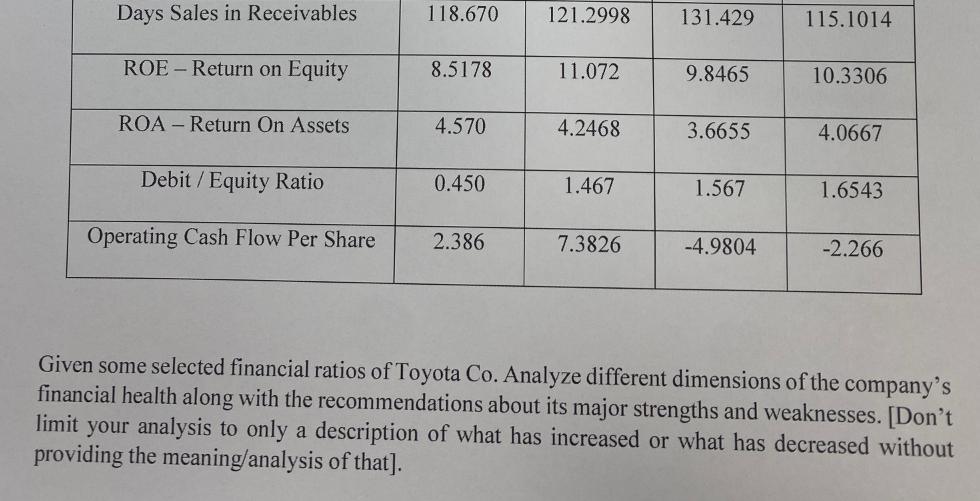
The following is a table (1) that summarizes some selected financial ratios of Toyota Co. for the three recent years from 2020 till 2022 and Industry Average: Table(1) Toyota Co. Selected Financial Ratios and Industry Average Industry Average Selected Financial Ratios Current ratio Gross Margin Operating Margin Pre-Tax Profit Margin Net Profit Margin Total Assets Turnover Receivable Turnover 1.4786 16.9914 12.1464 8.8632 6.68 0.505 3.870 2022 1.0861 19.0305 9.3467 12.717 9.0827 0.4696 2.9919 2021 1.0613 17.7566 8.0759 10.6649 8.2502 0.4312 2.7639 2020 1.0413 18.0676 8.1603 8.5363 6.9368 0.5681 3.2273 Days Sales in Receivables ROE - Return on Equity ROA - Return On Assets Debit/Equity Ratio Operating Cash Flow Per Share 118.670 8.5178 4.570 0.450 2.386 121.2998 11.072 4.2468 1.467 7.3826 131.429 9.8465 3.6655 1.567 -4.9804 115.1014 10.3306 4.0667 1.6543 -2.266 Given some selected financial ratios of Toyota Co. Analyze different dimensions of the company's financial health along with the recommendations about its major strengths and weaknesses. [Don't limit your analysis to only a description of what has increased or what has decreased without providing the meaning/analysis of that].
Step by Step Solution
★★★★★
3.34 Rating (151 Votes )
There are 3 Steps involved in it
Step: 1
Deep Dive into Toyotas Financial Health 20202022 This analysis goes beyond surfacelevel changes and delves into the meaning and implications of Toyotas financial ratios Strengths 1 Liquidity and Solve...
Get Instant Access to Expert-Tailored Solutions
See step-by-step solutions with expert insights and AI powered tools for academic success
Step: 2

Step: 3

Ace Your Homework with AI
Get the answers you need in no time with our AI-driven, step-by-step assistance
Get Started


