Answered step by step
Verified Expert Solution
Question
1 Approved Answer
THE FOLLOWING IS RECENT ECONOMETRIC MODEL FOR STUDYING SCALE AND SCOPE ECONOMIES OF FINANCIAL INFORMATION INSTITUTIONS. A total cost function of producing multiple outputs of
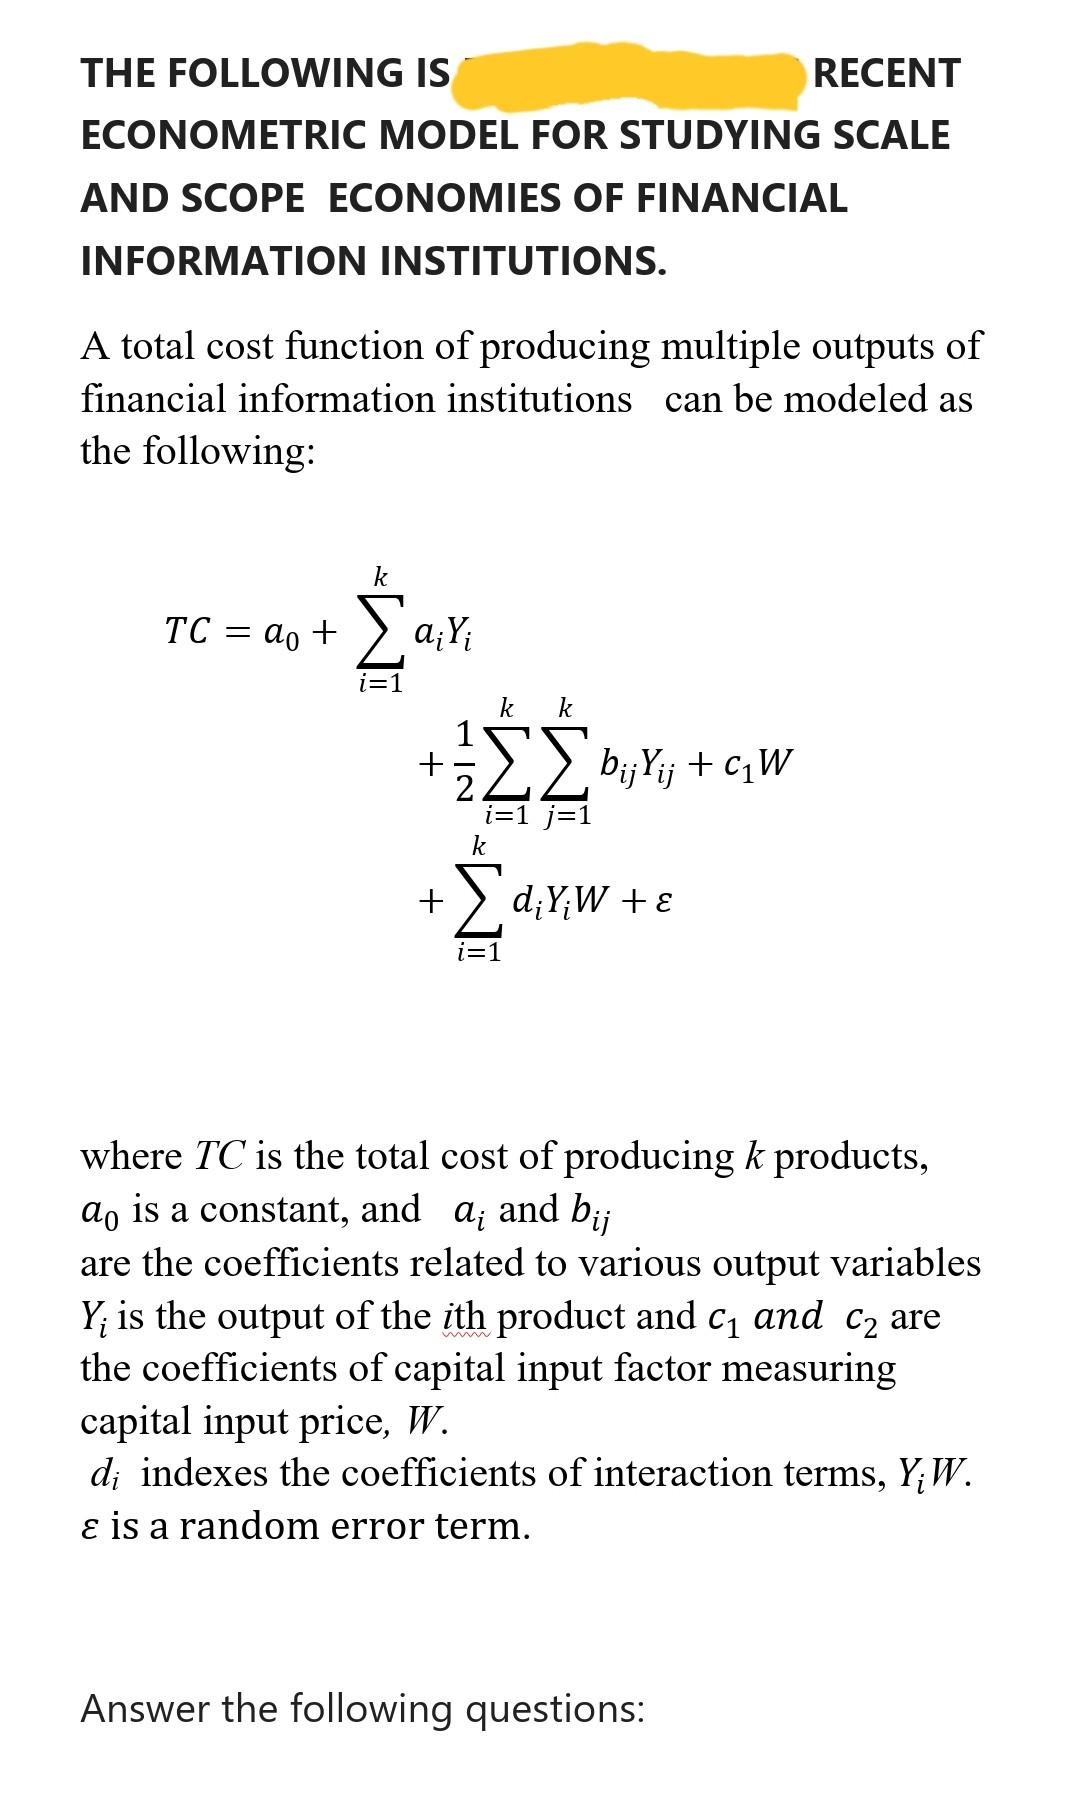
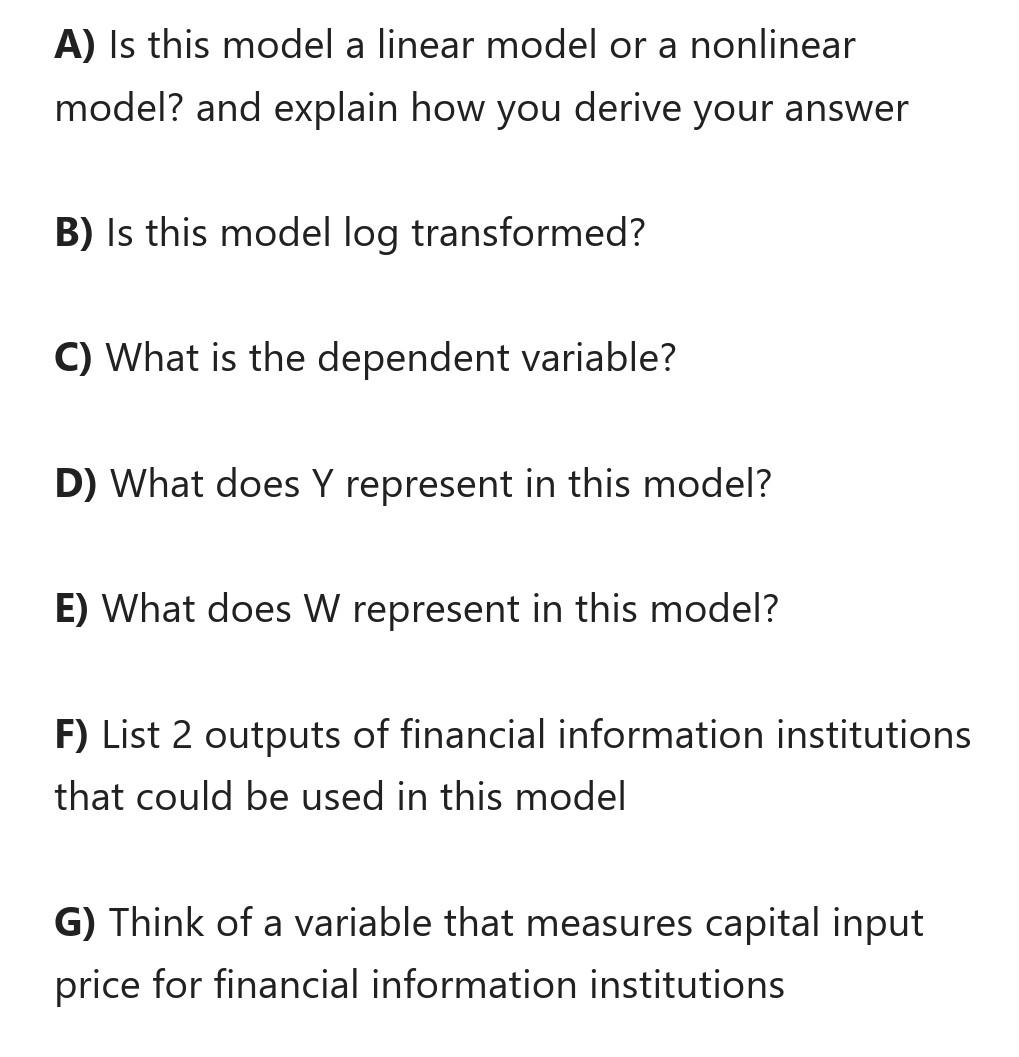
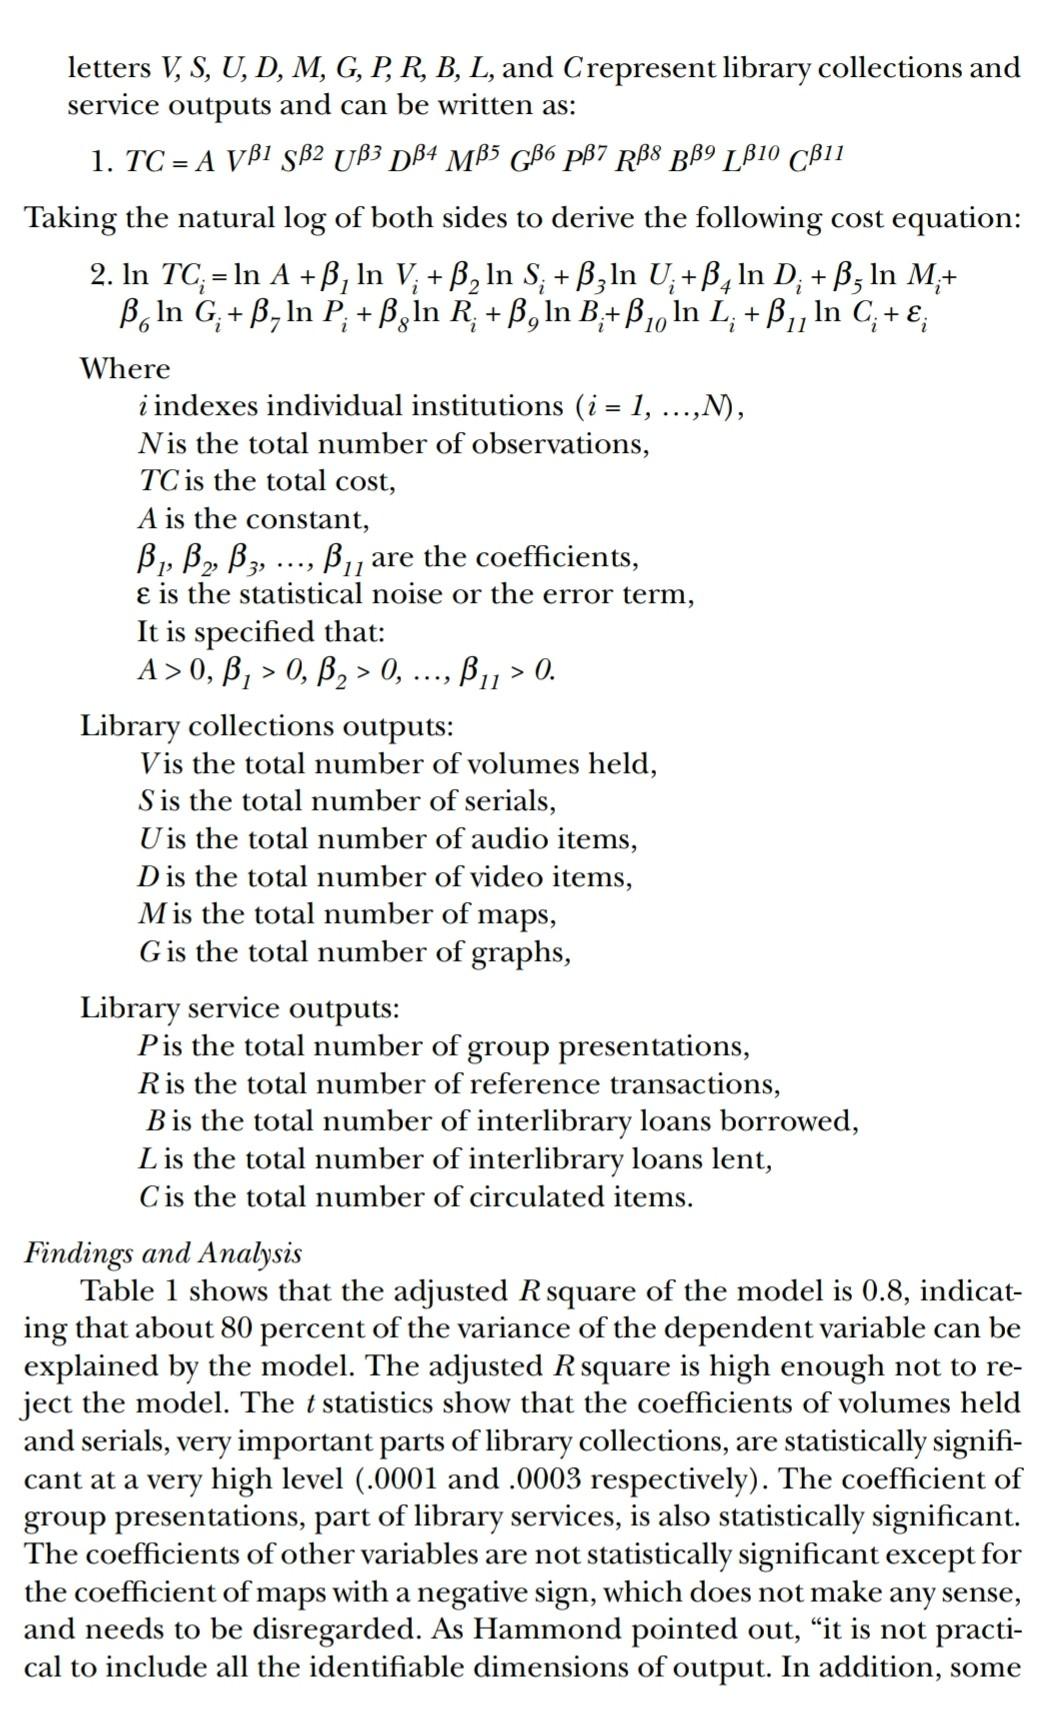
THE FOLLOWING IS RECENT ECONOMETRIC MODEL FOR STUDYING SCALE AND SCOPE ECONOMIES OF FINANCIAL INFORMATION INSTITUTIONS. A total cost function of producing multiple outputs of financial information institutions can be modeled as the following: k TC = do + = a i=1 Y k k 1 bijYij +ciw i=1 j=1 k + SdY/W+ dY i=1 where TC is the total cost of producing k products, do is a constant, and a; and bij are the coefficients related to various output variables Y is the output of the ith product and C1 and ca are the coefficients of capital input factor measuring capital input price, W. di indexes the coefficients of interaction terms, YW. is a random error term. w Answer the following questions: A) Is this model a linear model or a nonlinear model? and explain how you derive your answer B) Is this model log transformed? C) What is the dependent variable? D) What does Y represent in this model? E) What does W represent in this model? F) List 2 outputs of financial information institutions that could be used in this model G) Think of a variable that measures capital input price for financial information institutions difficult, if not impossible. Back issues of journals are used a great deal by both faculty and students because they contain accumulated research find- ings in the past and are indispensable for research and teaching. To study scale economies of academic research libraries without including serials would miss a critical part of academic research library output. Serials col- lections consume a large portion of academic research libraries' budgets and were treated as an important output variable in this study. Other Library Collections as Output. In addition to volumes held and se- rials, other library collections, such as audios, videos, and maps were also treated as library outputs since they are different kinds of materials from volumes and serials. The prices of these materials differ from those of vol- umes and serials and do incur costs related to staff time and library equip- ment in order to make them readily available for use. In general, some li- brary materials such as large-sized maps and some audio and video items may well be in-house use materials. Circulation records do not record such use of library collections. Although it is true that only a small portion of library collections is used at a certain time period, it does not necessarily mean that only that portion incurs costs. Library Services as Output. Libraries provide various types of services in- cluding reference service, instruction in the form of library workshops and seminars, borrowing items through interlibrary loan for local users and lending items through interlibrary loan to external users, and circulation service. These services incur costs in terms of staff time, facilities, and equip- ment necessary to carry out these activities. Reference service can be mea- sured by reference transactions, and library workshops and seminars are measured by library group presentations. Interlibrary loan and circulation data are also readily available from the ARL dataset. Library Costs. Total library expenditures were used as a measure of to- tal library costs on library materials, staff, binding, and other operating activities. Library materials expenditures consist of costs for monographs, serials, other materials such as maps, audio and visual items, and the items other than materials such as bibliographic utilities. Total salary expendi- tures include those for professional staff, non-professional staff, and stu- dent assistants. The Model. The general form of total cost function is the following: TC = f (V, S, U, D, M, G, P, R, B, L, C); TC, the total cost, is a function of a wide range of library outputs. The = a letters V, S, U, D, M, G, P, R, B, L, and Crepresent library collections and service outputs and can be written as: 1. TC = A VB1 SB2 UB3 DB4 MB5 GB6 p7 RB8 BB9 LB10 CB11 Taking the natural log of both sides to derive the following cost equation: 2. In TC; = In A +B, In V; + B2 In S; + B3 In U;+B4 In D; +B; In M,+ B. In G+B. In P + B, in R+B, In B+B In L+B In C+E, 1 2 2 5 7 8 11 1 = > > Where i indexes individual institutions (i = 1, ...,N), Nis the total number of observations, TC is the total cost, A is the constant, B1, B2, B3, ..., Bu are the coefficients, e is the statistical noise or the error term, It is specified that: A > 0, B, > 0, B2 > 0, ..., Bu > 0. Library collections outputs: Vis the total number of volumes held, Sis the total number of serials, U is the total number of audio items, D is the total number of video items, Mis the total number of maps, G is the total number of graphs, Library service outputs: Pis the total number of group presentations, R is the total number of reference transactions, B is the total number of interlibrary loans borrowed, L is the total number of interlibrary loans lent, C is the total number of circulated items. Findings and Analysis Table 1 shows that the adjusted R square of the model is 0.8, indicat- ing that about 80 percent of the variance of the dependent variable can be explained by the model. The adjusted R square is high enough not to re- ject the model. The t statistics show that the coefficients of volumes held and serials, very important parts of library collections, are statistically signifi- cant at a very high level (.0001 and .0003 respectively). The coefficient of group presentations, part of library services, is also statistically significant. The coefficients of other variables are not statistically significant except for the coefficient of maps with a negative sign, which does not make any sense, and needs to be disregarded. As Hammond pointed out, it is not practi- cal to include all the identifiable dimensions of output. In addition, some THE FOLLOWING IS RECENT ECONOMETRIC MODEL FOR STUDYING SCALE AND SCOPE ECONOMIES OF FINANCIAL INFORMATION INSTITUTIONS. A total cost function of producing multiple outputs of financial information institutions can be modeled as the following: k TC = do + = a i=1 Y k k 1 bijYij +ciw i=1 j=1 k + SdY/W+ dY i=1 where TC is the total cost of producing k products, do is a constant, and a; and bij are the coefficients related to various output variables Y is the output of the ith product and C1 and ca are the coefficients of capital input factor measuring capital input price, W. di indexes the coefficients of interaction terms, YW. is a random error term. w Answer the following questions: A) Is this model a linear model or a nonlinear model? and explain how you derive your answer B) Is this model log transformed? C) What is the dependent variable? D) What does Y represent in this model? E) What does W represent in this model? F) List 2 outputs of financial information institutions that could be used in this model G) Think of a variable that measures capital input price for financial information institutions difficult, if not impossible. Back issues of journals are used a great deal by both faculty and students because they contain accumulated research find- ings in the past and are indispensable for research and teaching. To study scale economies of academic research libraries without including serials would miss a critical part of academic research library output. Serials col- lections consume a large portion of academic research libraries' budgets and were treated as an important output variable in this study. Other Library Collections as Output. In addition to volumes held and se- rials, other library collections, such as audios, videos, and maps were also treated as library outputs since they are different kinds of materials from volumes and serials. The prices of these materials differ from those of vol- umes and serials and do incur costs related to staff time and library equip- ment in order to make them readily available for use. In general, some li- brary materials such as large-sized maps and some audio and video items may well be in-house use materials. Circulation records do not record such use of library collections. Although it is true that only a small portion of library collections is used at a certain time period, it does not necessarily mean that only that portion incurs costs. Library Services as Output. Libraries provide various types of services in- cluding reference service, instruction in the form of library workshops and seminars, borrowing items through interlibrary loan for local users and lending items through interlibrary loan to external users, and circulation service. These services incur costs in terms of staff time, facilities, and equip- ment necessary to carry out these activities. Reference service can be mea- sured by reference transactions, and library workshops and seminars are measured by library group presentations. Interlibrary loan and circulation data are also readily available from the ARL dataset. Library Costs. Total library expenditures were used as a measure of to- tal library costs on library materials, staff, binding, and other operating activities. Library materials expenditures consist of costs for monographs, serials, other materials such as maps, audio and visual items, and the items other than materials such as bibliographic utilities. Total salary expendi- tures include those for professional staff, non-professional staff, and stu- dent assistants. The Model. The general form of total cost function is the following: TC = f (V, S, U, D, M, G, P, R, B, L, C); TC, the total cost, is a function of a wide range of library outputs. The = a letters V, S, U, D, M, G, P, R, B, L, and Crepresent library collections and service outputs and can be written as: 1. TC = A VB1 SB2 UB3 DB4 MB5 GB6 p7 RB8 BB9 LB10 CB11 Taking the natural log of both sides to derive the following cost equation: 2. In TC; = In A +B, In V; + B2 In S; + B3 In U;+B4 In D; +B; In M,+ B. In G+B. In P + B, in R+B, In B+B In L+B In C+E, 1 2 2 5 7 8 11 1 = > > Where i indexes individual institutions (i = 1, ...,N), Nis the total number of observations, TC is the total cost, A is the constant, B1, B2, B3, ..., Bu are the coefficients, e is the statistical noise or the error term, It is specified that: A > 0, B, > 0, B2 > 0, ..., Bu > 0. Library collections outputs: Vis the total number of volumes held, Sis the total number of serials, U is the total number of audio items, D is the total number of video items, Mis the total number of maps, G is the total number of graphs, Library service outputs: Pis the total number of group presentations, R is the total number of reference transactions, B is the total number of interlibrary loans borrowed, L is the total number of interlibrary loans lent, C is the total number of circulated items. Findings and Analysis Table 1 shows that the adjusted R square of the model is 0.8, indicat- ing that about 80 percent of the variance of the dependent variable can be explained by the model. The adjusted R square is high enough not to re- ject the model. The t statistics show that the coefficients of volumes held and serials, very important parts of library collections, are statistically signifi- cant at a very high level (.0001 and .0003 respectively). The coefficient of group presentations, part of library services, is also statistically significant. The coefficients of other variables are not statistically significant except for the coefficient of maps with a negative sign, which does not make any sense, and needs to be disregarded. As Hammond pointed out, it is not practi- cal to include all the identifiable dimensions of output. In addition, some
Step by Step Solution
There are 3 Steps involved in it
Step: 1

Get Instant Access to Expert-Tailored Solutions
See step-by-step solutions with expert insights and AI powered tools for academic success
Step: 2

Step: 3
Ace Your Homework with AI
Get the answers you need in no time with our AI-driven, step-by-step assistance
Get Started