Answered step by step
Verified Expert Solution
Link Copied!

Question

1 Approved Answer

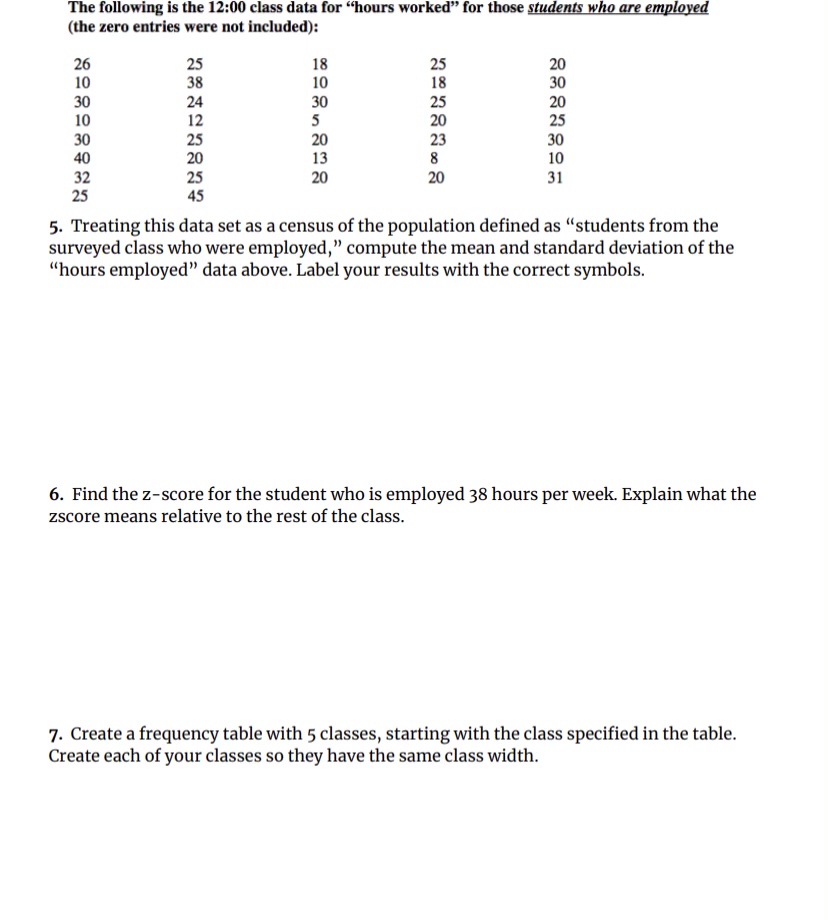
The following is the 12:00 class data for hours worked for those students who are employed (the zero entries were not included): 25 20 26

image text in transcribed
The following is the 12:00 class data for "hours worked" for those students who are employed (the zero entries were not included): 25 20 26 25 18 10 18 30 10 38 25 20 30 24 30 12 5 20 25 10 30 30 25 20 23 40 20 13 10 25 20 20 5. Treating this data set as a census of the population defined as "students from the surveyed class who were employed," compute the mean and standard deviation of the "hours employed" data above. Label your results with the correct symbols. 6. Find the z-score for the student who is employed 38 hours per week. Explain what the zscore means relative to the rest of the class. 7. Create a frequency table with 5 classes, starting with the class specified in the table. Create each of your classes so they have the same class width

Step by Step Solution

There are 3 Steps involved in it

Step: 1

blur-text-image

Get Instant Access to Expert-Tailored Solutions

See step-by-step solutions with expert insights and AI powered tools for academic success

Step: 2

blur-text-image

Step: 3

blur-text-image

Ace Your Homework with AI

Get the answers you need in no time with our AI-driven, step-by-step assistance

Get Started

Recommended Textbook for

Contemporary Business Mathematics With Canadian Applications

Authors: Ali R. Hassanlou, S. A. Hummelbrunner, Kelly Halliday

12th Edition

0135285011, 978-0135285015

More Books

Students also viewed these Mathematics questions