

Question
The following is the income statement for Home Max Inc. of fiscal year ended January 31, 2016, and the balance sheets for year 2015 and
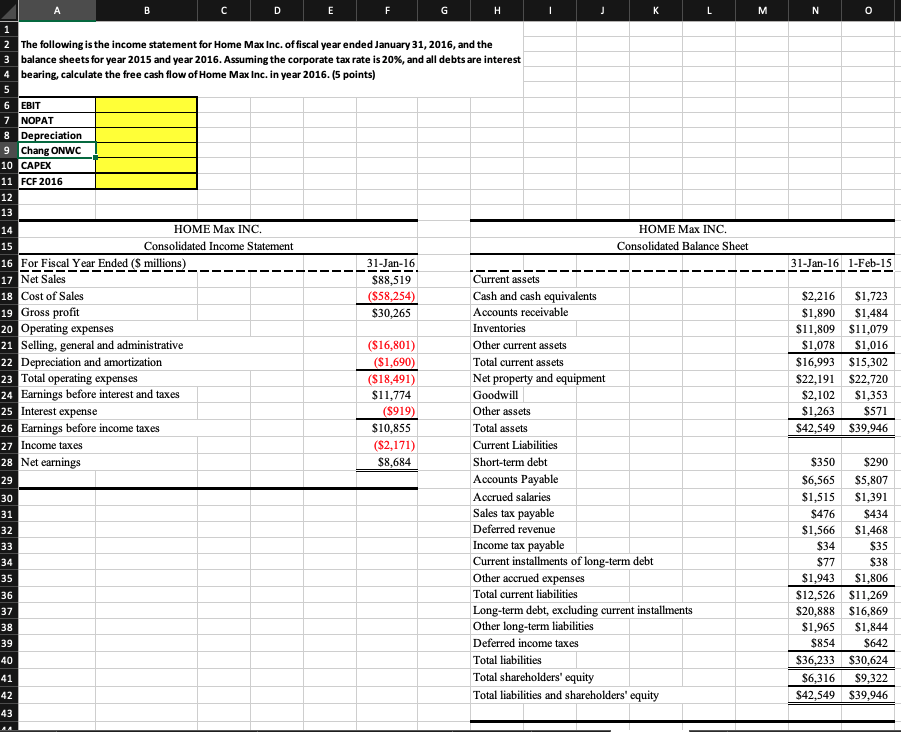
The following is the income statement for Home Max Inc. of fiscal year ended January 31, 2016, and the balance sheets for year 2015 and year 2016. Assuming the corporate tax rate is 20%, and all debts are interest bearing, calculate the free cash flow of Home Max Inc. in year 2016
E F H J K L M N o 1 2 The following is the income statement for Home Max Inc. offiscal year ended January 31, 2016, and the 3 balance sheets for year 2015 and year 2016. Assuming the corporate tax rate is 20%, and all debts are interest 4 bearing, calculate the free cash flow of Home Max Inc. in year 2016. (5 points) 5 6 EBIT 7 NOPAT 8 Depreciation 9 Chang ONWC 10 CAPEX 11 FCF 2016 12 13 HOME Max INC. Consolidated Balance Sheet 31-Jan-16 1-Feb-15 31-Jan-16 $88,519 ($58,254) $30,265 14 HOME Max INC. 15 Consolidated Income Statement 16 For Fiscal Year Ended (S millions) 17 Net Sales 18 Cost of Sales 19 Gross profit 20 Operating expenses 21 Selling, general and administrative 22 Depreciation and amortization 23 Total operating expenses 24 Earnings before interest and taxes 25 Interest expense 26 Earnings before income taxes 27 Income taxes 28 Net earnings 29 ($16,801) ($1,690) ($18,491) $11,774 ($919) $10,855 ($2,171) $8,684 $2,216 $1,723 $1,890 $1,484 $11,809 $11,079 $1,078 $1,016 $16,993 $15,302 $22,191 $22,720 $2,102 $1,353 $1,263 $571 $42,549 $39,946 Current assets Cash and cash equivalents Accounts receivable Inventories Other current assets Total current assets Net property and equipment Goodwill Other assets Total assets Current Liabilities Short-term debt Accounts Payable Accrued salaries Sales tax payable Deferred revenue Income tax payable Current installments of long-term debt Other accrued expenses Total current liabilities Long-term debt, excluding current installments Other long-term liabilities Deferred income taxes Total liabilities Total shareholders' equity Total liabilities and shareholders' equity 30 31 32 33 34 35 $350 S290 $6,565 $5,807 $1,515 $1,391 $476 $434 $1,566 $1,468 $34 $35 $77 $38 $1,943 $1,806 $12,526 $11,269 $20,888 $16,869 $1,965 $1,844 $854 $642 $36,233 $30,624 $6,316 $9,322 $42,549 $39,946 36 37 38 39 40 41 42 43 E F H J K L M N o 1 2 The following is the income statement for Home Max Inc. offiscal year ended January 31, 2016, and the 3 balance sheets for year 2015 and year 2016. Assuming the corporate tax rate is 20%, and all debts are interest 4 bearing, calculate the free cash flow of Home Max Inc. in year 2016. (5 points) 5 6 EBIT 7 NOPAT 8 Depreciation 9 Chang ONWC 10 CAPEX 11 FCF 2016 12 13 HOME Max INC. Consolidated Balance Sheet 31-Jan-16 1-Feb-15 31-Jan-16 $88,519 ($58,254) $30,265 14 HOME Max INC. 15 Consolidated Income Statement 16 For Fiscal Year Ended (S millions) 17 Net Sales 18 Cost of Sales 19 Gross profit 20 Operating expenses 21 Selling, general and administrative 22 Depreciation and amortization 23 Total operating expenses 24 Earnings before interest and taxes 25 Interest expense 26 Earnings before income taxes 27 Income taxes 28 Net earnings 29 ($16,801) ($1,690) ($18,491) $11,774 ($919) $10,855 ($2,171) $8,684 $2,216 $1,723 $1,890 $1,484 $11,809 $11,079 $1,078 $1,016 $16,993 $15,302 $22,191 $22,720 $2,102 $1,353 $1,263 $571 $42,549 $39,946 Current assets Cash and cash equivalents Accounts receivable Inventories Other current assets Total current assets Net property and equipment Goodwill Other assets Total assets Current Liabilities Short-term debt Accounts Payable Accrued salaries Sales tax payable Deferred revenue Income tax payable Current installments of long-term debt Other accrued expenses Total current liabilities Long-term debt, excluding current installments Other long-term liabilities Deferred income taxes Total liabilities Total shareholders' equity Total liabilities and shareholders' equity 30 31 32 33 34 35 $350 S290 $6,565 $5,807 $1,515 $1,391 $476 $434 $1,566 $1,468 $34 $35 $77 $38 $1,943 $1,806 $12,526 $11,269 $20,888 $16,869 $1,965 $1,844 $854 $642 $36,233 $30,624 $6,316 $9,322 $42,549 $39,946 36 37 38 39 40 41 42 43Step by Step Solution
There are 3 Steps involved in it
Step: 1

Get Instant Access to Expert-Tailored Solutions
See step-by-step solutions with expert insights and AI powered tools for academic success
Step: 2

Step: 3
Ace Your Homework with AI
Get the answers you need in no time with our AI-driven, step-by-step assistance
Get Started
Day Trading Strategies And Risk Management
Authors: Richard N. Williams
1st Edition
979-8863610528